IREN 13-day bearish forecast — Nov 1, 2026
- Bias: Bearish
- Timeframe: 13 days (made Nov 1, 2026, target date Nov 13, 2026)
- Price at analysis: $23.97
- Price target: $22.60
- Expected range: $21.00 – $24.90
- Result: Correct (-26.1%) — closed at $17.71 on Nov 13, 2026; quality score 50/100
Get a free AI analysis of IREN today
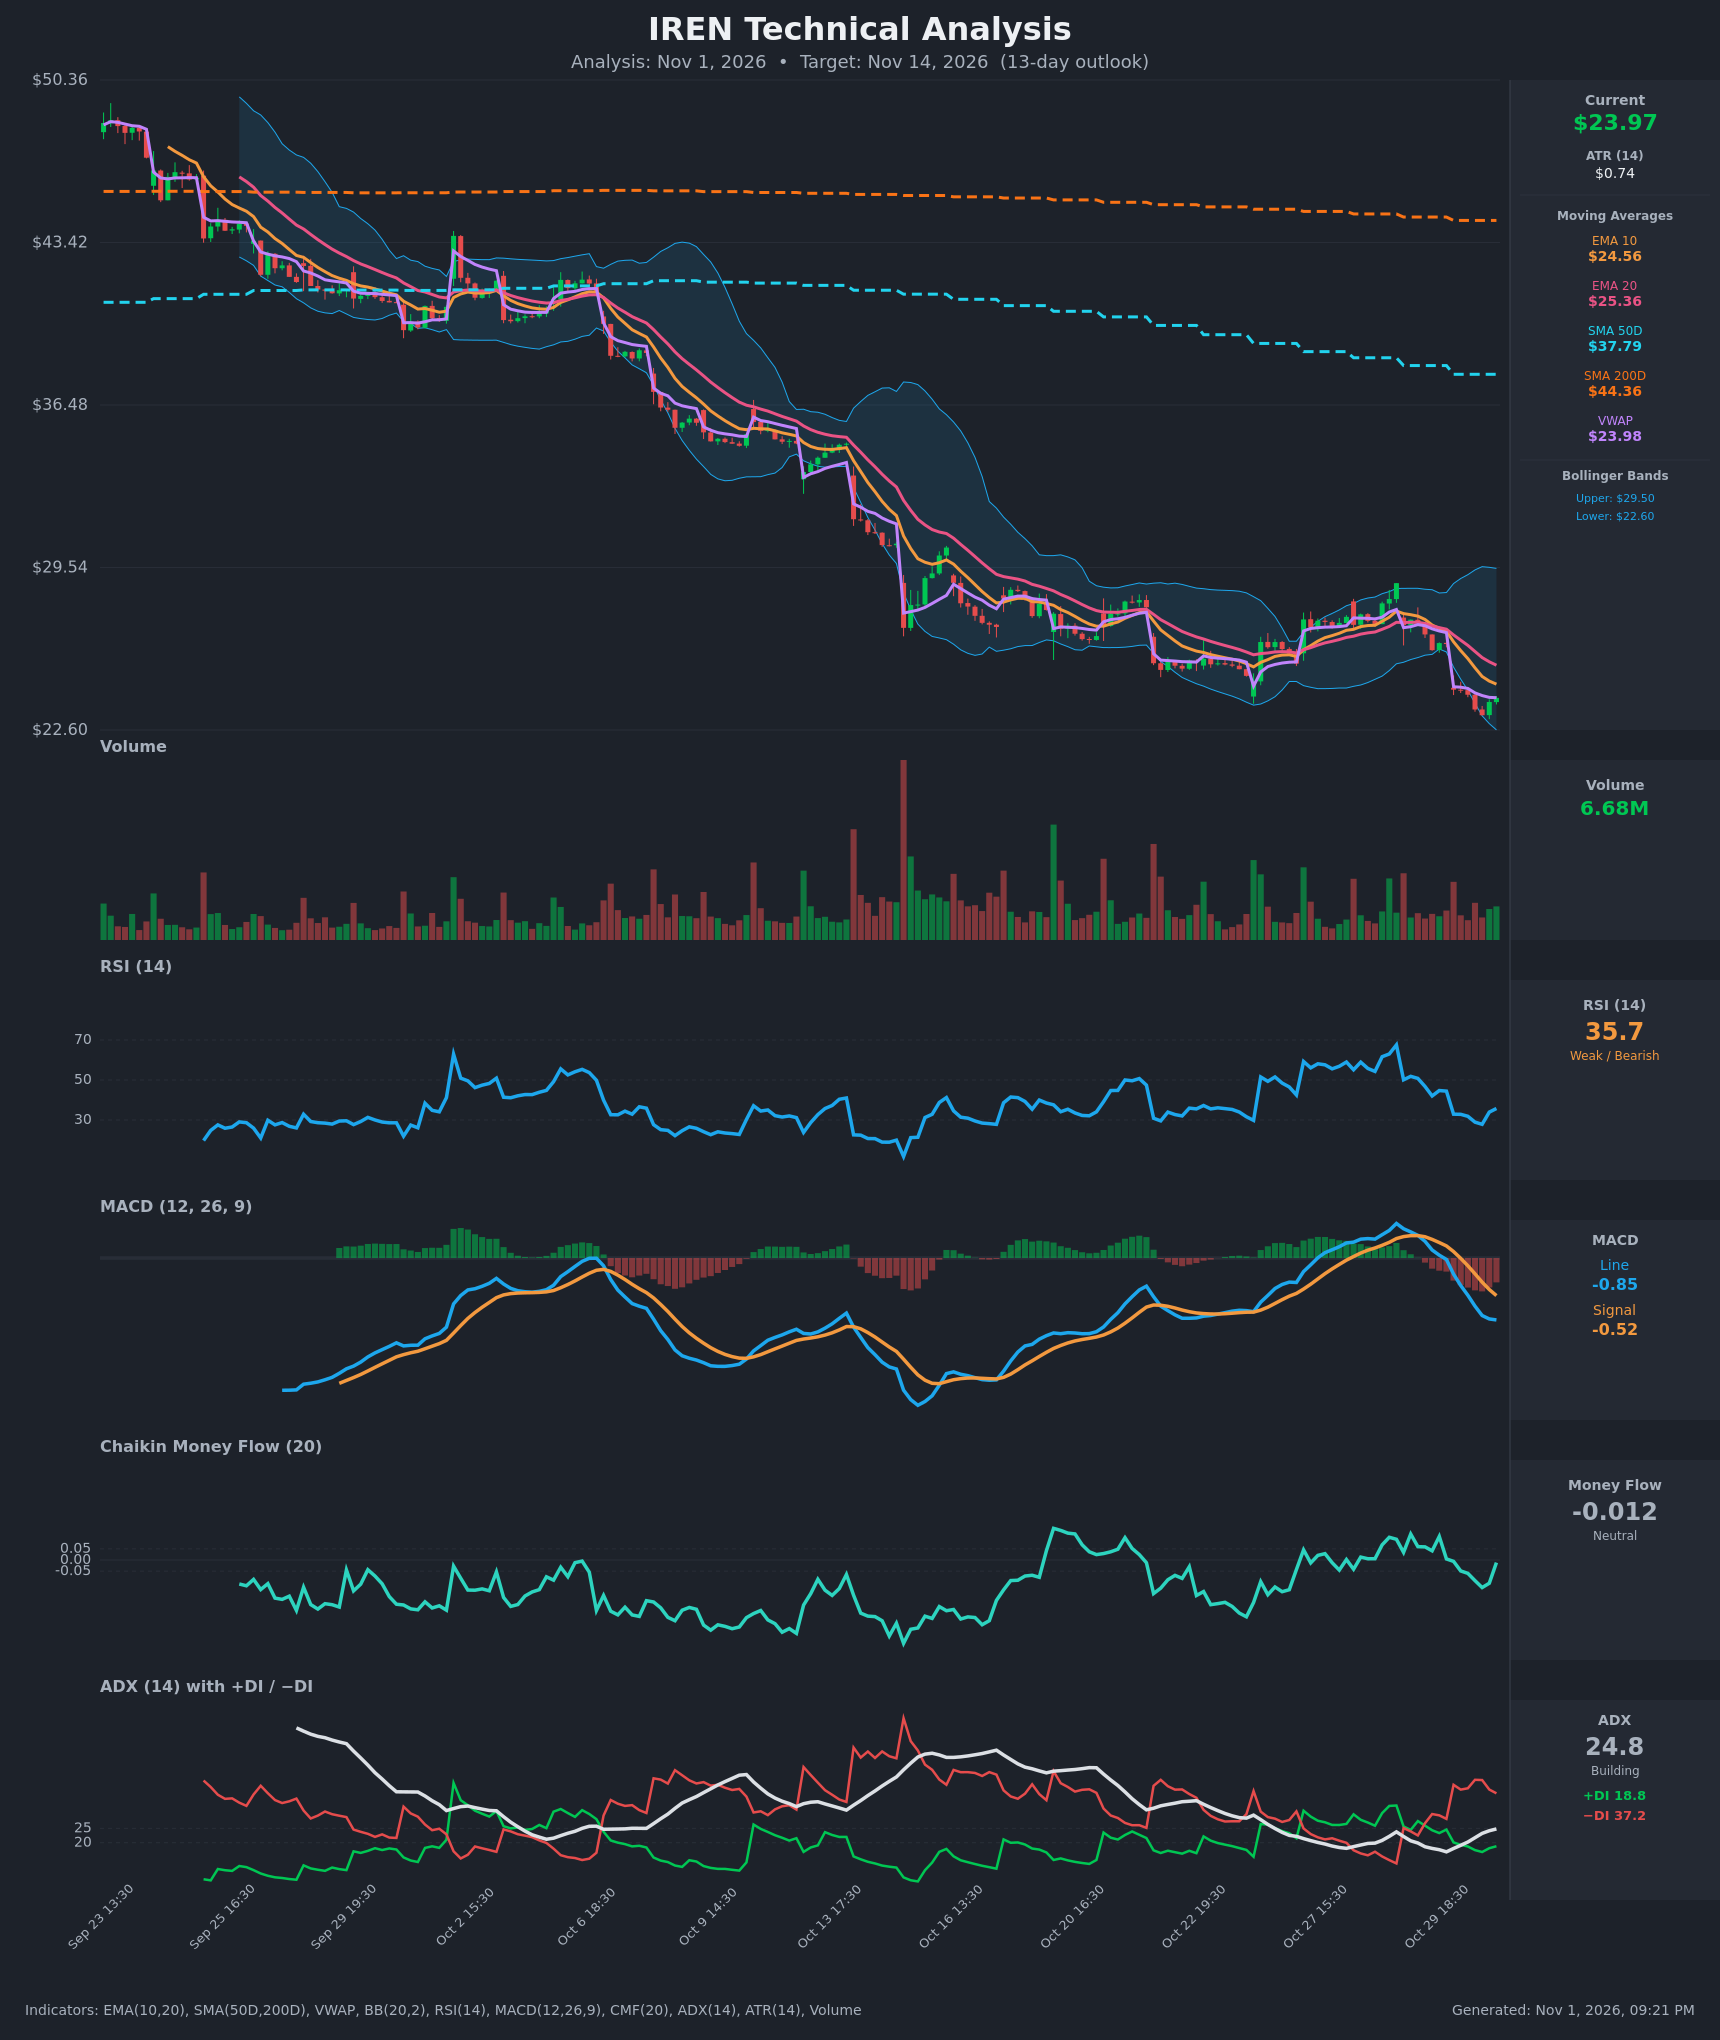
Analysis
TECHNICAL INDICATORS
- RSI (14): 35.75, rebounding from 27.9 oversold on Oct 30 but still below 50. It has been in a bearish range (mostly 25-50) for weeks, and the bounce is weak. [Bearish]
- 20 EMA: $25.36, with price at $23.97 below it. EMA10 ($24.56) is below EMA20, and both are sloping down. The 20 EMA is overhead resistance. [Bearish]
- MACD: Line -0.853 is below signal -0.518. It crossed bearishly on Oct 30 and the histogram is expanding negative. Momentum is accelerating down. [Bearish]
- Bollinger Bands (20): Upper $29.50, lower $22.60. Price at $23.97 sits in the lower quarter of the bands, about $1.37 above the lower band. The bands are wide after the recent volatility. Price is riding the lower half, which is typical of a downtrend. [Bearish]
- CMF (20): -0.012, neutral (between ±0.05). It dipped to -0.123 and has recovered, so selling pressure is easing but there is no accumulation yet. [Neutral]
- ADX (14): 24.8 and rising, close to the 25 strong-trend threshold. −DI (37.2) is far above +DI (18.8), so bears are firmly in control. [Strong Trend - Bearish]
- Volume: 6.68M, average with no capitulation spike. The last bounce bars show modest green volume, but there is no sign of a reversal. The drop to new lows came on moderate volume. [Neutral to mildly bearish]
DIVERGENCES & TRENDS
- Price is below SMA50 ($37.79) and SMA200 ($44.36), and the SMA50 is below the SMA200. This is a death-cross structure and a confirmed long-term downtrend.
- Price is at or near its lows, and RSI is at 35.75 after bottoming near 28. This is not a clear bullish divergence. RSI did not make a meaningfully higher low versus the prior troughs, so oversold bounce potential is limited.
- The MACD bearish crossover on Oct 30 and the DI spread (−DI 37 vs +DI 19) confirm downside momentum.
- Price is trading at VWAP ($23.98), so there is short-term balance, but price is below all the EMAs.
- CMF has improved from -0.12 to -0.01, which is a mild improvement in flow but not a trend change.
- Overall the series is lower highs and lower lows, with a gap-down on Oct 30.
CHART PATTERNS
- The chart shows a persistent descending channel with lower highs and lower lows. Since the mid-Oct peak, the Oct 22-29 rally formed what looks like a Bearish Flag/Rising Wedge (see the reference diagram), which broke down on Oct 30 with a gap.
- The flag-pole measure points to continued downside. The breakdown level was about $25-26, and the pattern implies a move toward the low $20s.
- Risk to the bearish view: a short-term bounce toward the EMA10/EMA20 ($24.56-$25.36) is possible after the RSI hit oversold, but that would be a retest of broken support.
POTENTIAL SCENARIOS
- Scenario 1: Bearish Trend Continuation — Price stays below the falling EMAs and MACD keeps expanding negative, with −DI dominant and ADX crossing above 25. Price breaks the lower Bollinger Band area and continues down. Trigger: Close below $22.60 (lower BB). Target: $20.50-$21.50. Invalidation: Daily close above $25.40 (EMA20). (50% probability)
- Scenario 2: Neutral Oversold Bounce Then Fade — RSI near oversold prompts a relief bounce to the EMA10/EMA20 zone, which then rejects. Price ends the window not far from current. Trigger: Hold above $22.60 and reclaim $24.56. Target: $24.50-$25.40, then fade back to about $23-$24. Invalidation: Break above $26.30 on volume. (30% probability)
- Scenario 3: Bullish Reversal — Selling exhausts, CMF turns positive, and MACD curls up. Price reclaims EMA20 and moves toward the prior flag breakdown zone. Trigger: Close above $25.40 with rising volume. Target: $27.00-$28.00. Invalidation: Fall back below $23.00. (20% probability)
PRICE TARGETS
For a 13-day timeframe, the range width should be roughly 8-12% of price, so about $2.00-$3.00 on a $23.97 stock. Because ATR is $0.74 (about 3.1% daily) and volatility is elevated, I use a width near 12%, about $2.90.
- Target Price: $22.60 (about 5.7% below current, driven by the bearish trend continuation and the flag-breakdown measure)
- Expected Range: $21.00 to $24.90 (width $3.90, about 16%; this is wider than the 8-12% guide because ATR volatility is high and the 13-day window spans a bear trend with wide Bollinger Bands)
- Key Levels: Support at $22.60, Resistance at $25.36
Self-check: width $3.90 / $23.97 = 16.3%. This is above the 8-12% guide for 14-21 days, but a 13-day horizon sits between the 7-10 and 14-21 day bands, and the elevated ATR justifies the wider range.
OVERALL BIAS
OVERALL BIAS: BEARISH - Price is below all key moving averages with a death-cross structure, a fresh bearish MACD crossover, and −DI (37.2) far above +DI (18.8) with ADX rising toward 25. A bounce to the $24.56-$25.36 EMA zone is likely to be sold, with downside toward the lower Bollinger Band and the low $20s.
This is educational analysis and not financial advice.