MARA 13-day bearish forecast — Nov 1, 2026
- Bias: Bearish
- Timeframe: 13 days (made Nov 1, 2026, target date Nov 13, 2026)
- Price at analysis: $6.76
- Price target: $6.60
- Expected range: $6.05 – $7.20
- Result: Incorrect (+1.6%) — closed at $6.87 on Nov 13, 2026; quality score 48/100
Get a free AI analysis of MARA today
Analysis
TECHNICAL INDICATORS
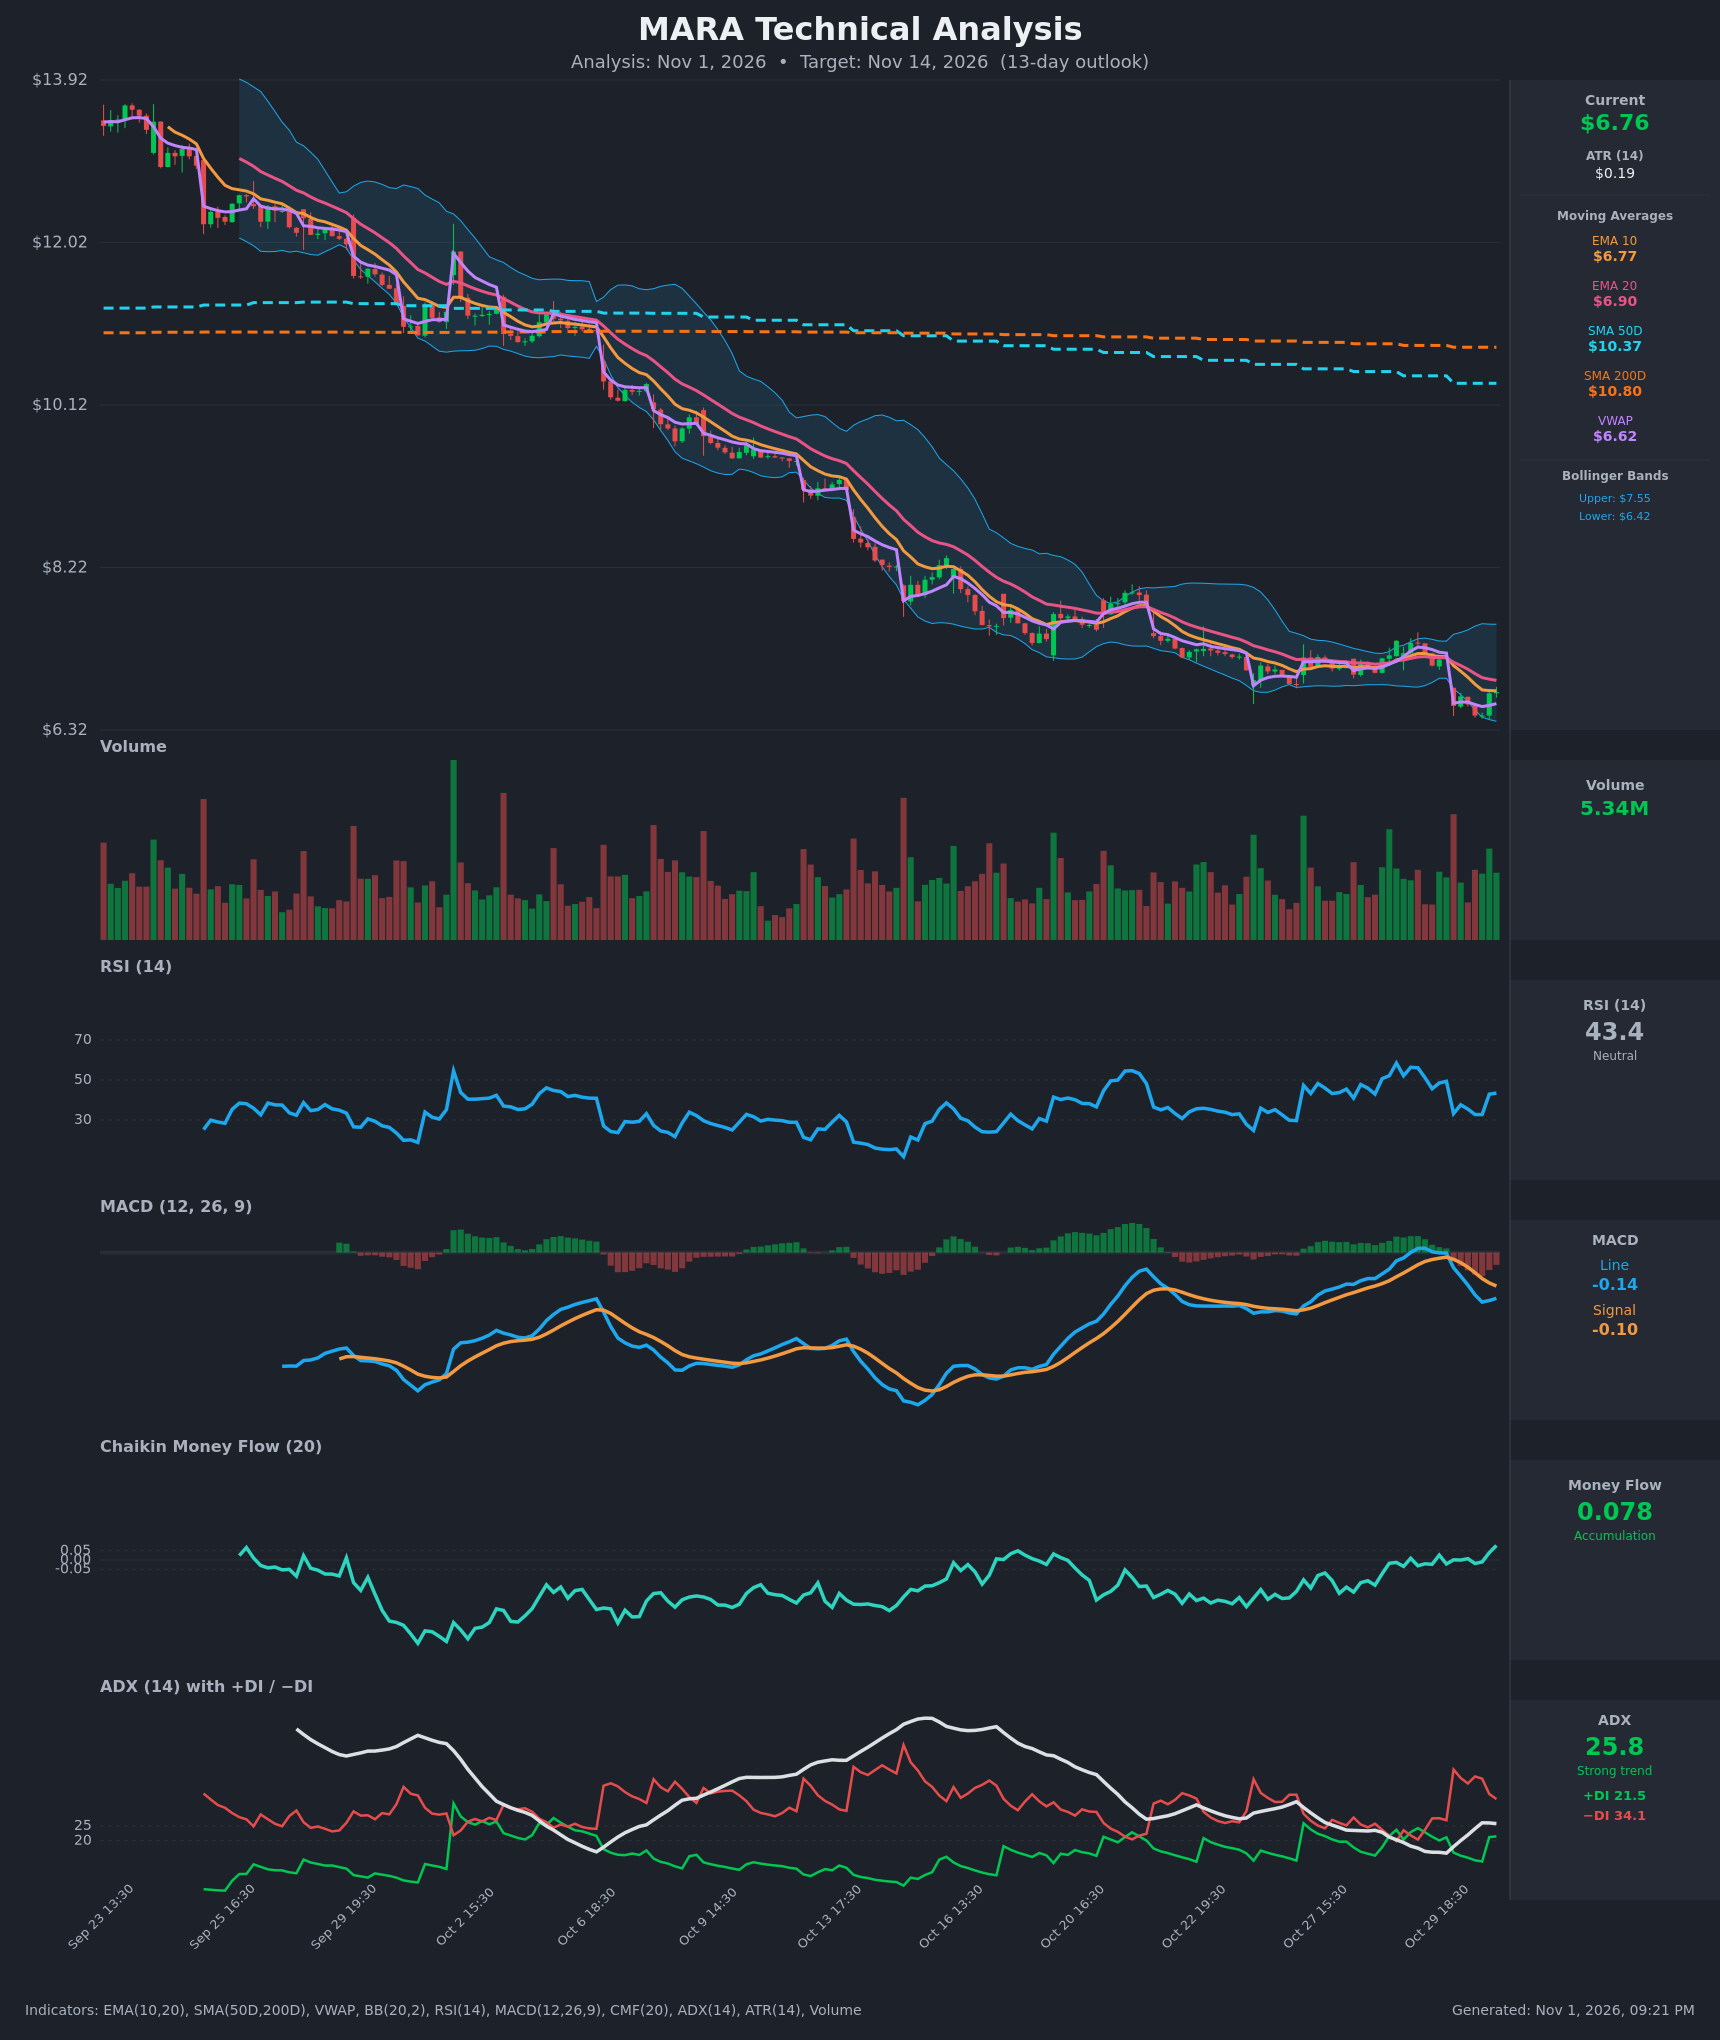
- RSI (14): 43.45, rebounding from 32.7 oversold-adjacent lows on Oct 30 but still below 50. Momentum is bearish-leaning with a small bounce underway. [Bearish]
- 20 EMA: $6.897, with price ($6.76) below it and the EMA 10 ($6.775) also above price. EMA10 is below EMA20, and both are sloping down, so the EMAs act as overhead resistance. [Bearish]
- MACD: Line -0.142 is below Signal -0.104, a bearish crossover on Oct 30 that remains in place. The histogram is negative and the MACD line is falling after rolling over from its recent peak. [Bearish]
- Bollinger Bands (20): Upper $7.55, lower $6.42, midline about $6.90. Price sits in the lower half, below the midline, after hitting the lower band area at $6.49. The bands are fairly narrow versus the prior downtrend, which suggests a compression phase. [Bearish]
- CMF (20): +0.078, above the +0.05 threshold and rising from deeply negative readings for most of October. It is the first accumulation signal in weeks, but it is only a fresh, marginal reading. [Accumulation]
- ADX (14): 25.8 with −DI 34.1 well above +DI 21.5. The ADX is turning up from a low of ~15, which signals a re-strengthening downtrend, although +DI is recovering from 13 to 21.5. [Strong Trend - Bearish]
- Volume: 5.34M, average with no clear capitulation spike. The green bars on the last bounces are modest, and the sell-off on Oct 30 had heavier red volume. [Neutral to mildly Bearish]
DIVERGENCES & TRENDS
- Price is in a persistent, relentless downtrend from ~$13.9 to $6.76, with lower highs and lower lows. It trades far below the SMA50 ($10.37) and SMA200 ($10.80), and the death-cross structure (SMA50 below SMA200) is in place.
- Mild bullish divergence candidate: CMF has turned positive (+0.078) while price made new lows, which shows some dip buying. RSI made a higher low (32.7 vs. earlier readings near 30), but this is not yet confirmed.
- MACD crossed down on Oct 30 and both lines are negative, which confirms bearish momentum.
- ADX is rising through 25 with −DI dominant, so trend strength is returning to the downside.
- The gap-down on Oct 30 ($7.16 → $6.60) broke the $7.00 support area, and that level is now resistance. VWAP at $6.62 is just below price, offering short-term support.
CHART PATTERNS
- The multi-week structure resembles a Bearish Rising Wedge / Bearish Flag-type continuation on the lower timeframe: a tight grind sideways between ~$6.9-$7.4, followed by a breakdown on Oct 30. This is a continuation of the larger downtrend.
- A possible Bullish Falling Wedge / Double Bottom is forming near $6.49-$6.60 (two lows at $6.49 on Oct 30), but the neckline around $6.90-$7.00 has not been reclaimed, so it is unconfirmed.
- Measured downside from the breakdown of the ~$7.0-$7.4 range (about $0.40-$0.60 height) points to roughly $6.40-$6.55.
POTENTIAL SCENARIOS
- Scenario 1: Bearish Continuation Lower — The downtrend resumes as price fails at the EMA10/EMA20 cluster ($6.77-$6.90) and the MACD/DI structure stays bearish. Trigger: rejection at $6.90 or a break below $6.49. Target: $6.30-$6.45, with an extension toward $6.10. Invalidation: daily close above $7.05. (50% probability)
- Scenario 2: Neutral Range-Bound Basing — Price chops between $6.45 and $7.00 as CMF accumulation offsets the bearish trend. Trigger: holds above $6.49 and stays below $6.95. Target: $6.60-$6.85. Invalidation: close outside the $6.40-$7.05 range. (25% probability)
- Scenario 3: Bullish Relief Bounce — The CMF turn and RSI higher low lead to a squeeze back toward the Bollinger midline and the upper band. Trigger: close above $6.95 with rising volume. Target: $7.30-$7.55. Invalidation: loss of $6.49. (25% probability)
PRICE TARGETS
- Target Price: $6.60 (13-day timeframe)
- Expected Range: $6.05 to $7.20 (width $1.15 ≈ 17% of current price, in line with the 14-21 day guidance for a high-volatility name with a 13-day horizon and ATR of $0.19)
- Key Levels: Support at $6.49, Resistance at $6.90
OVERALL BIAS
OVERALL BIAS: BEARISH - Price is below both EMAs with a bearish MACD crossover, −DI dominating at 34 vs. 21.5, and ADX rising above 25 in a long-term downtrend, with the SMAs far overhead. The fresh CMF accumulation reading tempers conviction and raises the odds of a relief bounce, but the trend favors a modestly lower close.
This is educational analysis and not financial advice.