GLD 13-day bearish forecast — Nov 1, 2026
- Bias: Bearish
- Timeframe: 13 days (made Nov 1, 2026, target date Nov 13, 2026)
- Price at analysis: $355.89
- Price target: $351.00
- Expected range: $338.00 – $366.00
- Result: Correct (-0.1%) — closed at $355.51 on Nov 13, 2026; quality score 100/100
Get a free AI analysis of GLD today
Analysis
TECHNICAL INDICATORS
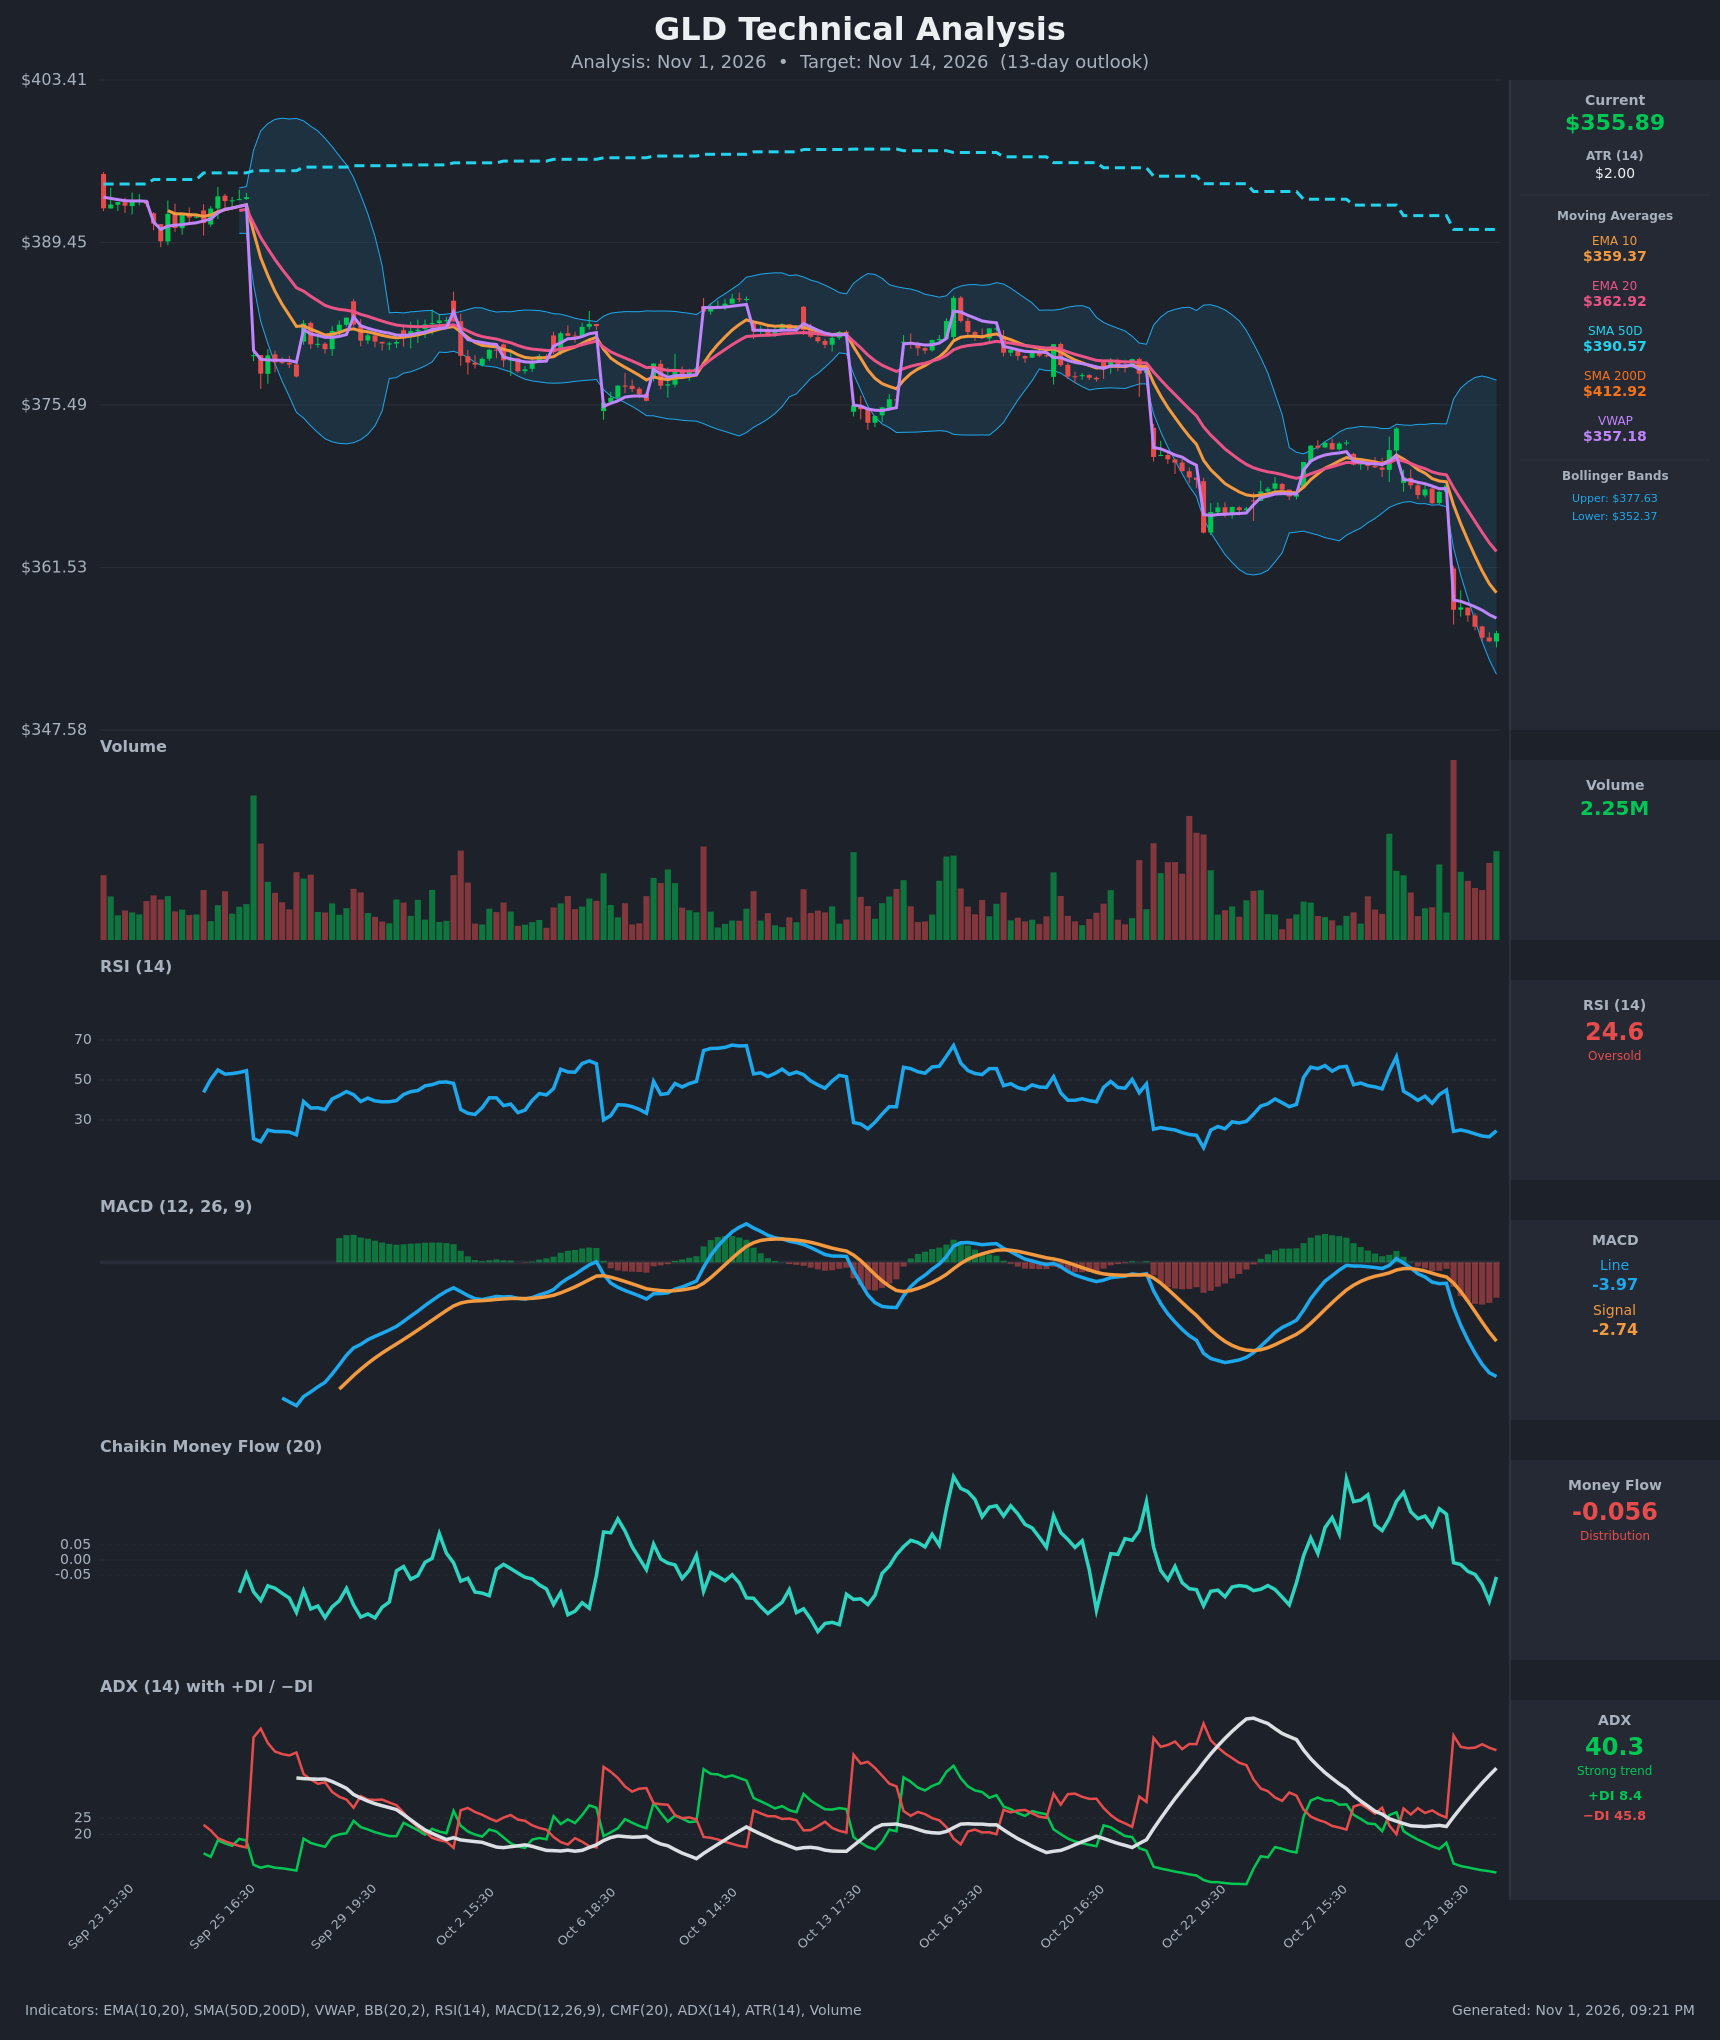
- RSI (14): 24.63, deeply oversold and near the Oct 30 low of 21.6, with a slight uptick in the last bar. It has been below 30 since the Oct 30 gap down, so momentum is still pointing down. Oversold readings in a strong trend can persist, though they raise the odds of a relief bounce. [Bearish]
- 20 EMA: $362.92, with the EMA10 at $359.37 below it. Price at $355.89 is below both and the gap is widening, so the EMAs are acting as overhead resistance. EMA10 crossed under EMA20 around Oct 30, which is a bearish crossover. [Bearish]
- MACD: Line -3.97 is below signal -2.74, and the histogram is about -1.23 and widening. The bearish crossover happened on Oct 29-30 and the line is still falling. There is no sign of momentum bottoming yet. [Bearish]
- Bollinger Bands (20): Upper $377.63, lower $352.37, so price sits in the bottom 14% of the band, about $3.50 above the lower band. The bands are wide after the volatile gap, and price has been walking the lower band. A close outside the lower band would confirm continued trend pressure, while a snap back toward the midline (~$365) would be a relief move. [Bearish]
- CMF (20): -0.056, just below the -0.05 threshold, after flipping from +0.2 to negative on the Oct 30 gap down. Selling pressure is only mild and the reading is ticking back toward neutral. [Distribution]
- ADX (14): 40.3 and rising sharply from about 22, with −DI at 45.8 and +DI at 8.4. This is a very strong, one-sided downtrend with bears firmly in control. The extreme ADX also hints at possible trend exhaustion in the near term. [Strong Trend - Bearish]
- Volume: 2.25M on the latest bar, with heavy selling volume on the Oct 30 gap down. Volume has since faded on the small basing and drifting bars. This is high-volume distribution followed by a lower-volume consolidation, which is typical of a bear flag. [Bearish]
Other moving averages and VWAP:
- SMA50 at $390.57 is below SMA200 at $412.92, so the death cross is already in place.
- Price is about 14% below SMA200 and about 9% below SMA50.
- VWAP at $357.18 is just above price, which is mild overhead resistance.
DIVERGENCES & TRENDS
- There is no bullish RSI divergence yet. RSI made a lower low (21.6) alongside a lower price low, so momentum and price are confirming each other.
- The trend is lower on every timeframe: EMA10 < EMA20 < SMA50 < SMA200, and price is below all of them.
- Each gap-down leg (Oct 22, Oct 30) was followed by only a partial retracement, with lower highs each time. That is a classic stair-step decline.
- MACD and the DI lines are all pointing down. The MACD histogram is the most negative in the displayed window.
- The first signs of stabilization are an RSI uptick from 21.6 to 24.6 and CMF rising from -0.138 to -0.056. These are tentative, not confirmed reversals.
CHART PATTERNS
- Bearish Flag / Pennant (continuation): After the sharp gap-down pole from about $368.6 to $357.9, price has drifted sideways to slightly lower in a tight range of $355-$358. This resembles the bearish flag/pennant in the reference diagram. The measured move of about $11 from a breakdown near $355 points to roughly $344-$346.
- Stair-step lower highs and lows: This is a descending structure through Oct. Resistance is the falling EMA20 near $363 and the Oct 29 breakdown area near $368.
- Bullish counter-case: No reversal pattern (double bottom, falling wedge) is confirmed yet. A relief bounce would need a break above the flag top near $358-$359 with rising volume.
POTENTIAL SCENARIOS
- Scenario 1: Bearish Flag Breakdown / Trend Continuation — Price breaks below the consolidation and the lower Bollinger Band as the strong ADX trend persists, with MACD still expanding lower. Trigger: hourly close below $352.37 on rising volume. Target: $344-$348, with a possible extension to $340. Invalidation: close above $363 (EMA20) with RSI back above 40. (50% probability)
- Scenario 2: Bullish Oversold Relief Bounce — RSI near 24 and the lower band support trigger short covering and a mean-reversion rally toward the moving averages. Trigger: break above $359.40 (EMA10) with an improving CMF. Target: $362.90-$366 (EMA20 and BB midline). Invalidation: close below $352 negates the bounce. (35% probability)
- Scenario 3: Neutral Choppy Base — Price stalls between roughly $350 and $360 as oversold conditions and trend pressure offset each other. Trigger: repeated holds above $352.4 with weak volume. Target: $353-$359. Invalidation: a decisive break outside $350-$362. (15% probability)
PRICE TARGETS
For 13 days (Nov 14, 2026):
- Target Price: $351.00
- Expected Range: $338.00 to $366.00 (width $28.00, about 7.9% of the current price, appropriate for a 13-day horizon, above a 2-3 day range and in line with the 7-10 day to 14-21 day guidance)
- Key Levels: Support at $352.37 (lower Bollinger Band), then $345; Resistance at $362.92 (EMA20), with $359.37 (EMA10) as first resistance
OVERALL BIAS
OVERALL BIAS: BEARISH - Price is below every moving average with a death cross in place, MACD is expanding lower, ADX is above 40 with −DI dominating, and the tight post-gap consolidation looks like a bearish flag. The oversold RSI (24.6) raises the risk of a sharp relief bounce, so conviction is moderate rather than high.
This is educational analysis and not financial advice.