NIO 13-day bearish forecast — Nov 1, 2026
- Bias: Bearish
- Timeframe: 13 days (made Nov 1, 2026, target date Nov 13, 2026)
- Price at analysis: $3.19
- Price target: $3.12
- Expected range: $2.92 – $3.34
- Result: Correct (-10.2%) — closed at $2.87 on Nov 13, 2026; quality score 73/100
Get a free AI analysis of NIO today
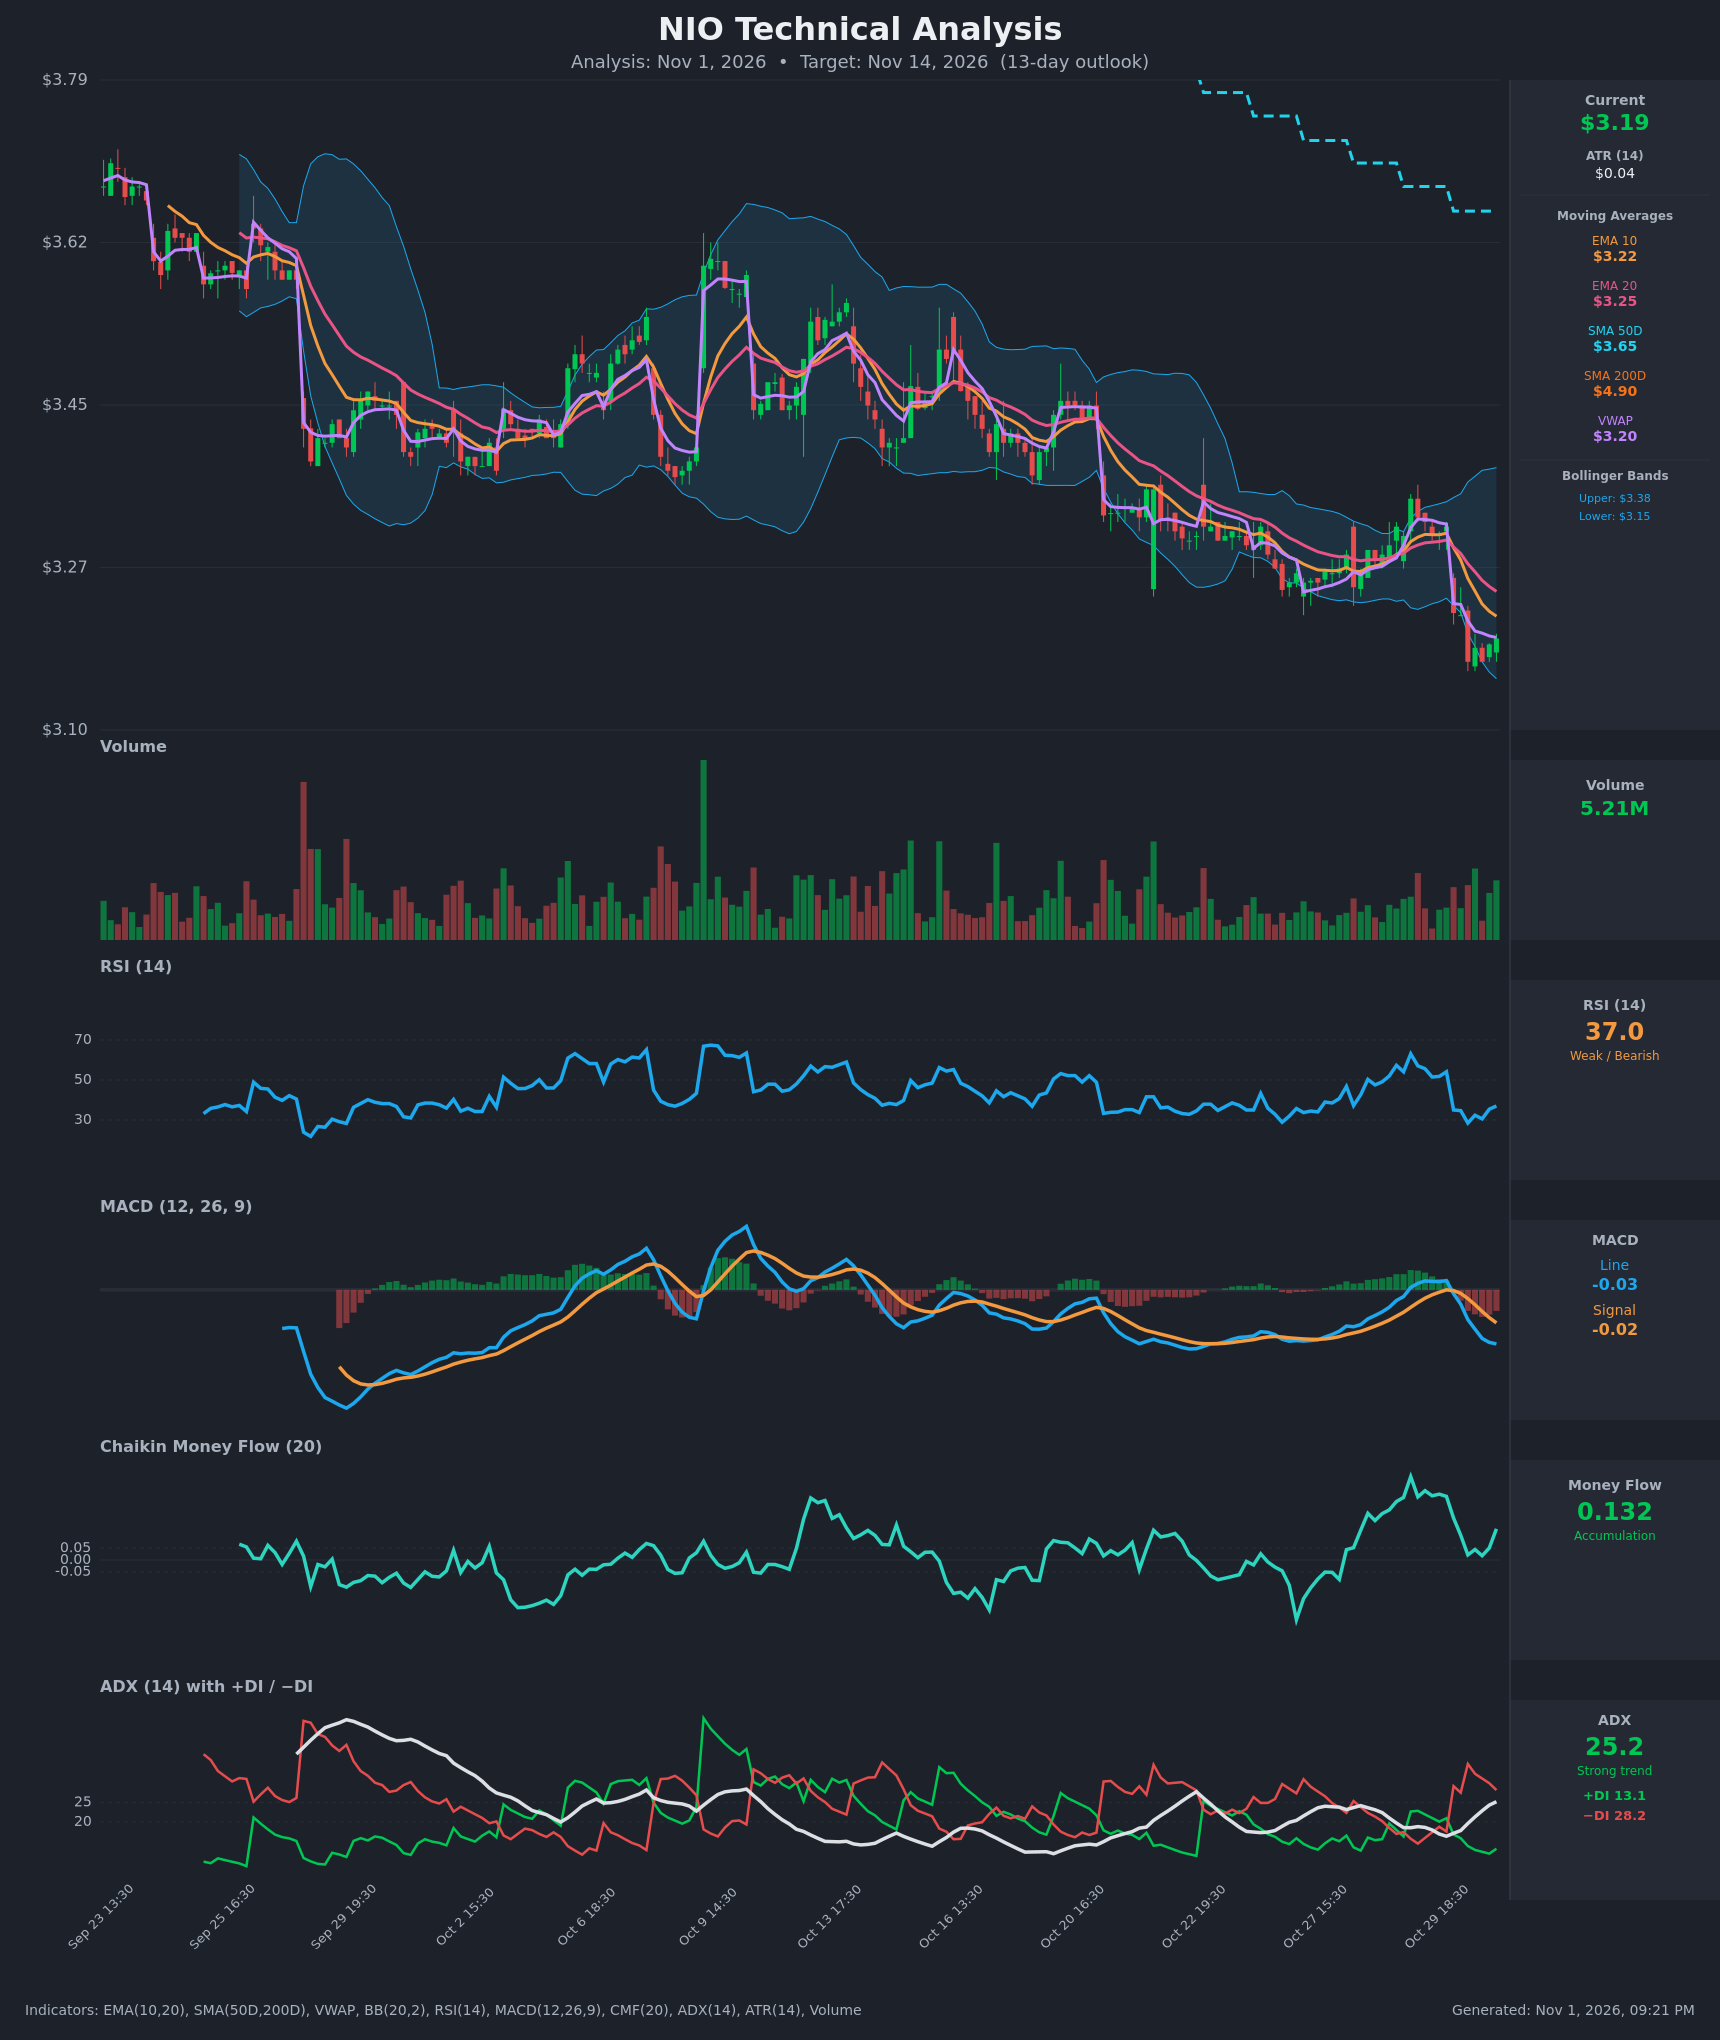
Analysis
TECHNICAL INDICATORS
- RSI (14): 37.0, rebounding slightly from a recent low of 28.5 (oversold) on Oct 30 but still below 50. Momentum is weak, with only a small bounce so far. [Bearish]
- 20 EMA: $3.2455, with EMA10 at $3.2189 below it. Price at $3.195 is below both, so the EMAs act as overhead resistance. The EMA10 is below the EMA20 and both are sloping down. [Bearish]
- MACD: Line -0.0291 is below Signal -0.0178 after a bearish crossover on Oct 30 (the line crossed below the signal at the open). The histogram is negative and widening, though the line is starting to flatten. [Bearish]
- Bollinger Bands (20): Upper $3.3783, lower $3.1519. Price at $3.195 sits in the lower quarter of the bands, close to the lower band after a sharp breakdown. The bands are expanding downward. A bounce toward the midline (about $3.26) is possible, but the trend is walking down the lower band. [Bearish]
- CMF (20): 0.132, above +0.05 and recovering from about 0.02. Money flow has stayed positive even as price fell, which suggests dip buying and possible hidden accumulation. This is the main bullish counterpoint. [Accumulation]
- ADX (14): 25.2 and rising from about 16, with −DI (28.2) well above +DI (13.1). Bears control a strengthening trend. [Strong Trend - Bearish]
- Volume: 5.21M, average to slightly above average, with a modest uptick on the latest green bars. There was no capitulation spike on the breakdown. Selling was orderly and the bounce volume is unconvincing. [Neutral to mildly bearish]
DIVERGENCES & TRENDS
- Moving averages: Price ($3.195) is below EMA10 ($3.219), EMA20 ($3.246), SMA50 ($3.654) and SMA200 ($4.899). The SMA50 is below the SMA200 (death cross already in place), so the long-term trend is firmly down.
- VWAP: Price is roughly at VWAP ($3.196), so there is no edge from it. Price is struggling to reclaim it.
- CMF vs price: CMF is positive and rising while price makes lower lows, a mild bullish divergence. It is not confirmed by RSI or MACD.
- RSI: It touched 28.5 and made a slightly higher low (about 32), a minor sign of stabilization, but it remains below 40.
- ADX/DI: −DI crossed above +DI on Oct 30 and the gap is widening. ADX crossing 25 confirms trend strength.
- MACD: The bearish crossover on Oct 30 is fresh. Both lines are below zero.
- Price action: Price has made a sequence of lower highs and lower lows from about $3.71 (late Sep) to $3.19, with a gap down on Oct 30.
CHART PATTERNS
- The dominant structure is a persistent descending channel, similar to the Bullish Falling Wedge or Descending Triangle in the reference. In a downtrend a descending channel is more often a continuation, in the spirit of the Bearish Flag/Pennant. The Oct 22-29 consolidation (about $3.27-$3.33) acted like a small flag and broke down on Oct 30, with a measured move of about $0.10-0.15, pointing toward $3.05-$3.10.
- There is no confirmed reversal pattern. A falling-wedge reversal would need a break above the EMA20 / upper band (about $3.25-$3.30) with MACD turning up.
- The target of the bearish flag breakdown is about $3.08-$3.12. The dashed cyan line on the chart (a step-down projection) also points lower.
POTENTIAL SCENARIOS
- Scenario 1: Bearish Trend Continuation — The downtrend continues with a strengthening ADX, −DI dominance and a negative MACD. Price probes below the lower Bollinger Band and the flag breakdown target. Trigger: a close below $3.15 (the lower band and recent low). Target: $3.05-$3.10. Invalidation: a daily close above $3.25 (EMA20). (55% probability)
- Scenario 2: Neutral/Bullish Relief Bounce, then Fade — The oversold RSI and positive CMF drive a bounce to the EMA10/EMA20 and the Bollinger midline, where sellers return. Trigger: a hold above $3.15 and a reclaim of $3.22. Target: $3.25-$3.33. Invalidation: a break below $3.15. (35% probability)
- Scenario 3: Bullish Reversal — Accumulation (CMF) leads to a trend change, with a break above $3.33 and a MACD bullish crossover. Trigger: a close above $3.33 on rising volume. Target: $3.45-$3.55. Invalidation: a failure to hold above $3.25. (10% probability)
PRICE TARGETS
- Target Price: $3.12 (13-day horizon)
- Expected Range: $2.92 to $3.34 (width $0.42, about 13% of current price, which fits the 14-21 day guidance of 8-12% at the upper end and is consistent for 13 days)
- Key Levels: Support at $3.05, Resistance at $3.25
OVERALL BIAS
OVERALL BIAS: BEARISH - Price is below all key moving averages with a bearish MACD crossover, ADX rising above 25 with −DI dominant, and a death cross in the long-term averages. Positive CMF and an RSI near oversold argue for a bounce, but the weight of evidence favors continuation lower.
This is educational analysis and not financial advice.