MSTR 13-day bearish forecast — Nov 1, 2026
- Bias: Bearish
- Timeframe: 13 days (made Nov 1, 2026, target date Nov 13, 2026)
- Price at analysis: $130.51
- Price target: $127.00
- Expected range: $120.50 – $134.00
- Result: Correct (-15.8%) — closed at $109.86 on Nov 13, 2026; quality score 50/100
Get a free AI analysis of MSTR today
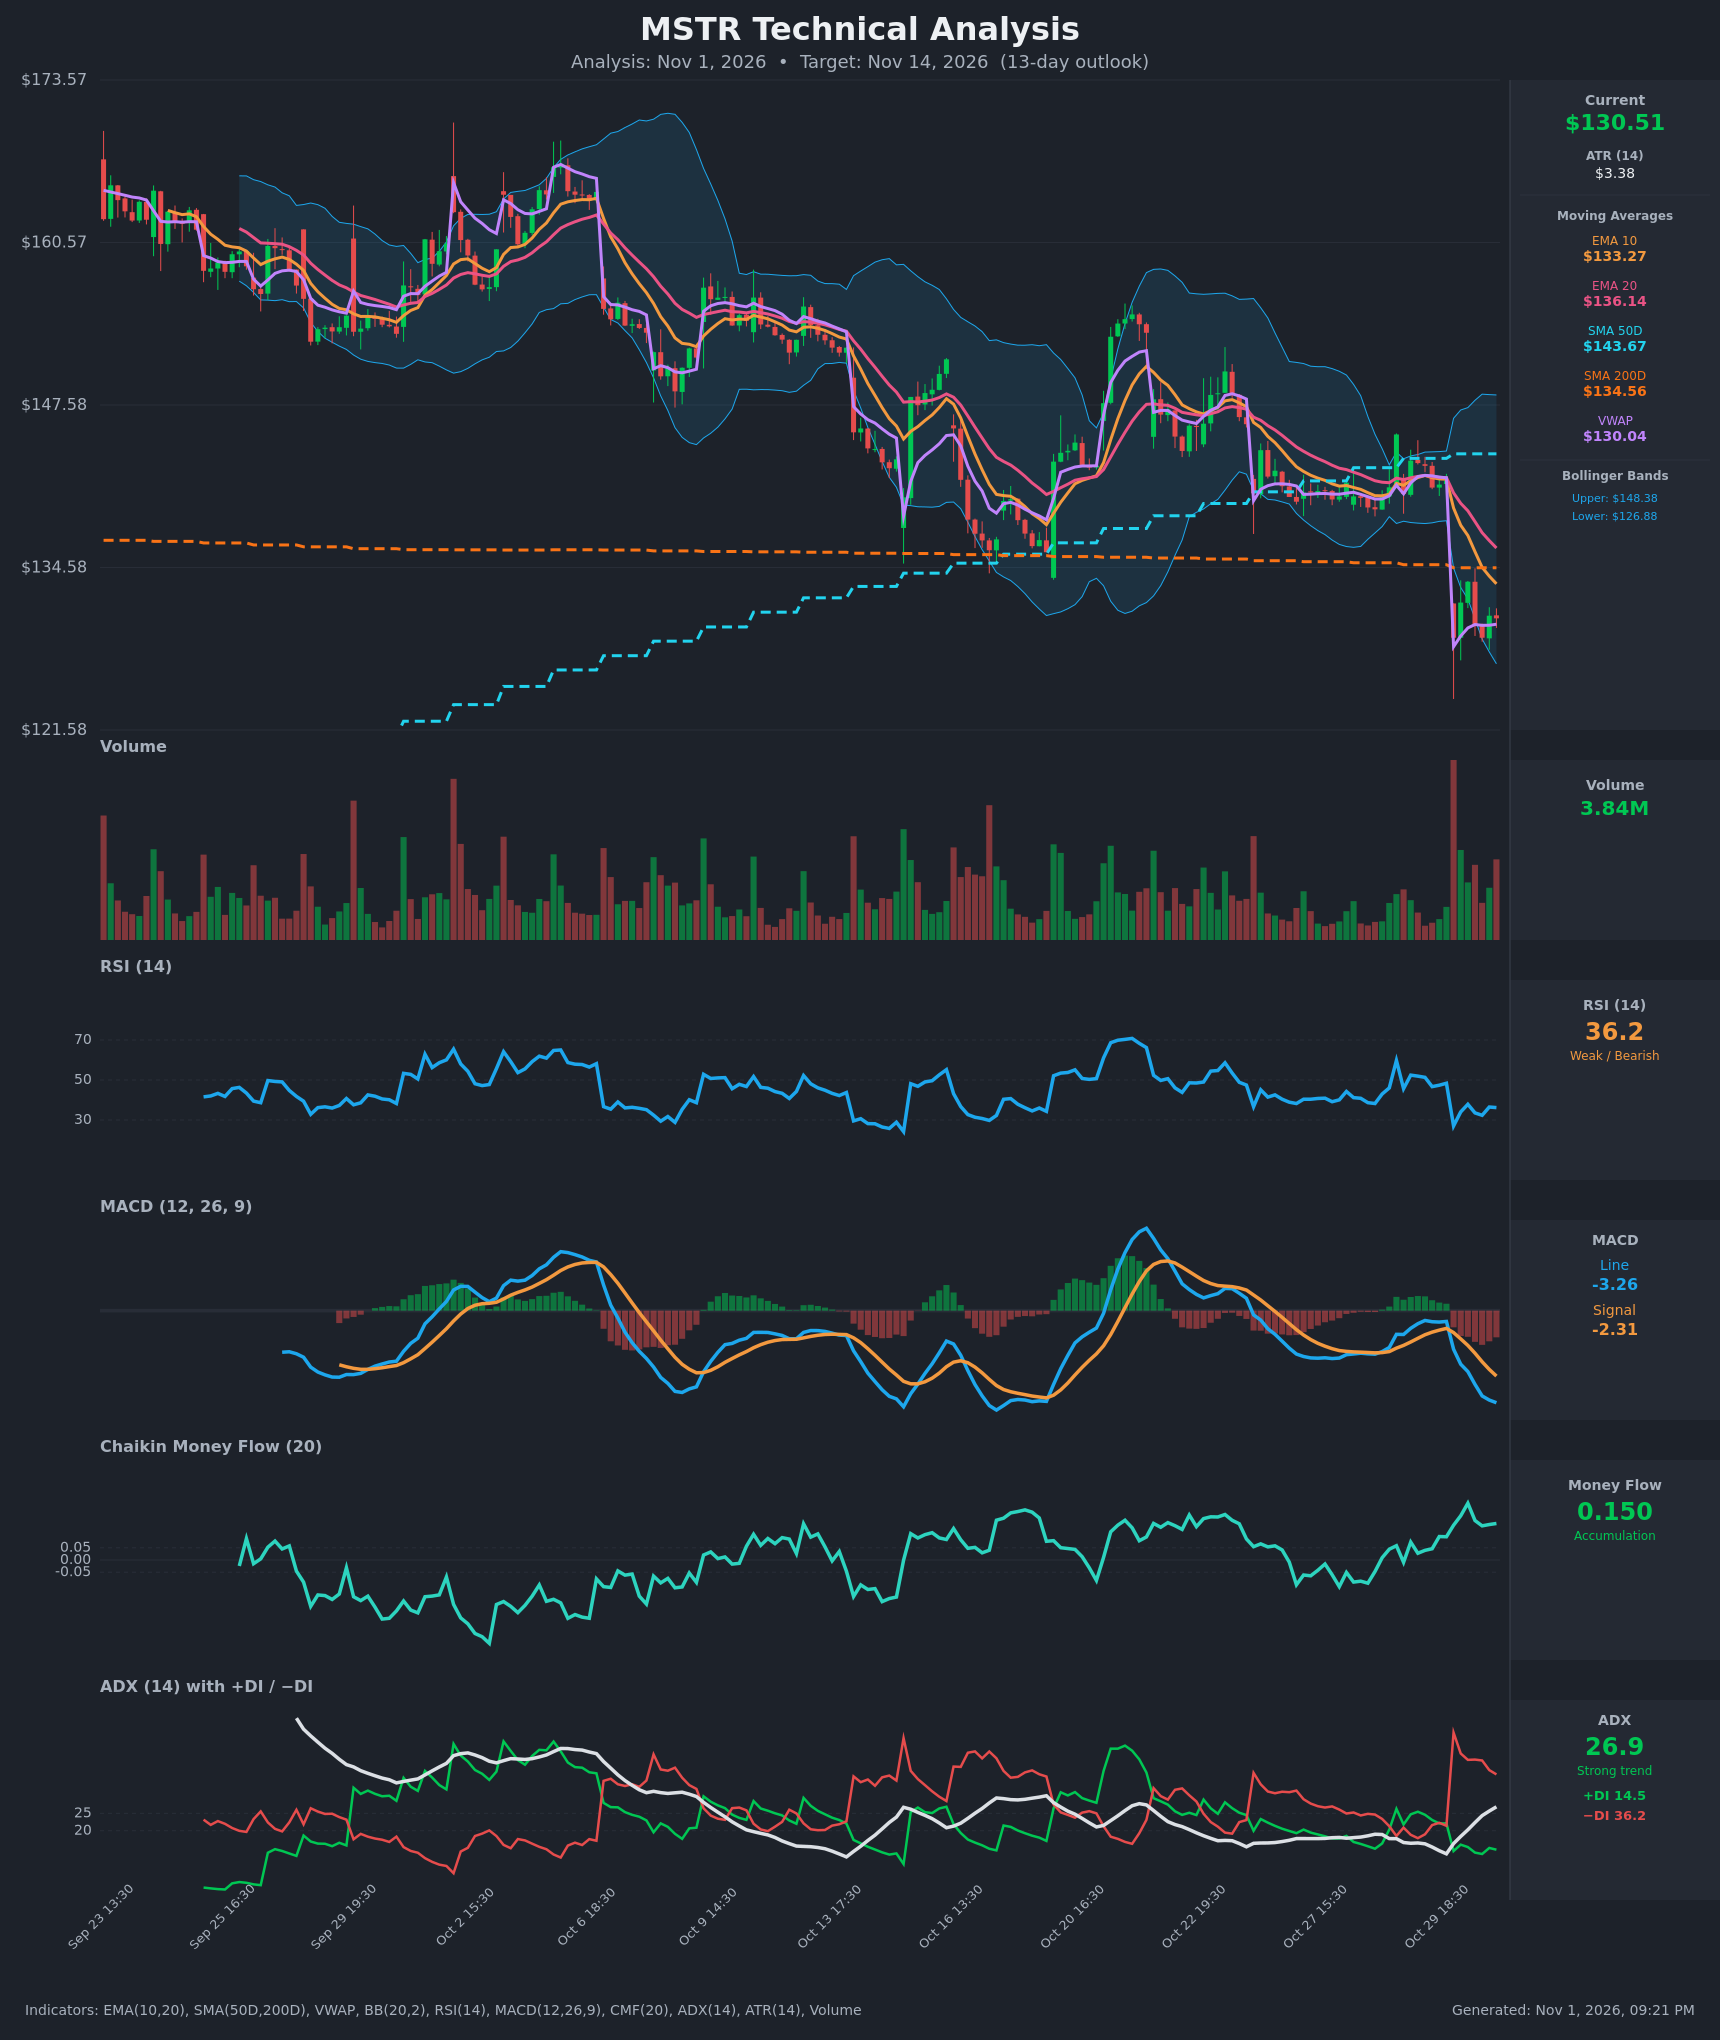
Analysis
TECHNICAL INDICATORS
- RSI (14): 36.2, down from the high 40s before the Oct 30 gap and a low of 27.0 on the gap bar. It has bounced only slightly from near-oversold and sits well below 50. Momentum is weak but not yet at an extreme. [Bearish]
- 20 EMA: $136.14, with the 10 EMA at $133.27 below it. Price at $130.51 is below both, so they act as overhead resistance. EMA10 is below EMA20 and the gap is widening. [Bearish]
- MACD: Line -3.26 is below signal -2.31, so the histogram is about -0.94 and still expanding negative. The bearish crossover is fresh and has not flattened. [Bearish]
- Bollinger Bands (20): Upper $148.38, lower $126.88. Price is in the lower third, about $3.6 above the lower band. The bands are wide after the gap, and price has not yet "walked" the lower band. A bounce toward the mid-band (~$137) is possible, but the trend is down. [Bearish]
- CMF (20): +0.150, above the +0.05 threshold and rising since Oct 29. Buying pressure is notable despite the price drop. This is a positive divergence, though it may be inflated by the gap bar's close position. [Accumulation]
- ADX (14): 26.9 and rising from 13 on Oct 29, so a strong trend is emerging. −DI at 36.2 is far above +DI at 14.5, so bears are firmly in control. [Strong Trend – Bearish]
- Volume: 3.84M, after the highest volume spike on the chart at the Oct 30 gap-down open. Follow-through volume has faded. That is consistent with an initial capitulation flush, but there is no confirmed reversal volume. [Neutral to Mildly Bearish]
Moving averages and VWAP:
- Price is below the SMA200 ($134.56), a fresh loss of long-term support, and below the SMA50 ($143.67).
- The SMA50 is still above the SMA200, so there is no death cross yet.
- Price is just above VWAP ($130.04), a thin intraday support level.
DIVERGENCES & TRENDS
- Positive CMF divergence: price made a new low (~$124–129) while CMF rose to +0.15. This suggests dip buying or accumulation and is the main bullish counterpoint.
- RSI: it made a low of 27 and bounced to 36, but it has not recovered above 40. There is no confirmed bullish divergence.
- Crossovers: the MACD bearish crossover is intact, EMA10 is below EMA20, and −DI surged above +DI on the gap.
- Trend: the chart shows a sequence of lower highs since early October, capped each time near the EMA20 and SMA50. The gap broke the $134–135 support zone (SMA200).
- ADX: it turned up from a low base, which signals trend strength building to the downside.
CHART PATTERNS
- The broader structure is a descending series of lower highs and lower lows, similar to a Descending Triangle / bearish continuation from the reference. Support near $134–135 (SMA200) has now been broken.
- The small, tight bars after the gap form a potential Bearish Flag / Pennant just under the broken support. A flag breakdown would project a measured move of roughly $5–8 below the flag (about $122–125).
- A failed retest of $134.56 and the EMA20 near $136 would confirm the breakdown. A reclaim above $136 would invalidate the flag and suggest a gap-fill rally toward $141–144.
POTENTIAL SCENARIOS
- Scenario 1: Bearish Trend Continuation — Price retests the broken SMA200/EMA10 zone, fails, and resumes lower under strong −DI dominance and a widening MACD histogram. Trigger: rejection at $133–135 or a break below $128.50 (flag low/VWAP area). Target: $124–127, with an extension to $121–122. Invalidation: daily close above $136.14 (EMA20). (50% probability)
- Scenario 2: Bullish Oversold Relief Bounce — The CMF accumulation and near-oversold RSI fuel a rebound toward the mid-band and a partial gap fill. Trigger: reclaim of $134.56 with rising volume. Target: $137–141. Invalidation: loss of $126.88 (lower band) or the $124 gap low. (35% probability)
- Scenario 3: Neutral Consolidation — Price chops between the gap low and the SMA200 as the market digests the drop. Trigger: failure to break $134.56 or $127.00 with fading ADX. Target: $128–133. Invalidation: a decisive close outside $126–135. (15% probability)
PRICE TARGETS
For the 13-day horizon (to Nov 14):
- Target Price: $127.00
- Expected Range: $120.50 to $134.00 (width $13.50, about 10.3% of the current price, in line with 13-day guidance)
- Key Levels: Support at $126.88 (lower Bollinger Band; the gap low near $124 is next), Resistance at $134.56 (SMA200, then the EMA20 at $136.14)
OVERALL BIAS
OVERALL BIAS: BEARISH - Price is below all key moving averages after a gap-down through the SMA200, with a fresh MACD bearish crossover, −DI (36.2) far above +DI (14.5), and ADX rising above 25. The positive CMF divergence and near-oversold RSI raise the odds of a relief bounce, but rallies into $134–136 look more likely to be sold.
This is educational analysis and not financial advice.