PFE 13-day bullish forecast — Nov 1, 2026
- Bias: Bullish
- Timeframe: 13 days (made Nov 1, 2026, target date Nov 13, 2026)
- Price at analysis: $30.50
- Price target: $30.95
- Expected range: $29.35 – $31.75
- Result: Incorrect (-5.4%) — closed at $28.86 on Nov 13, 2026; quality score 28/100
Get a free AI analysis of PFE today
Analysis
TECHNICAL INDICATORS
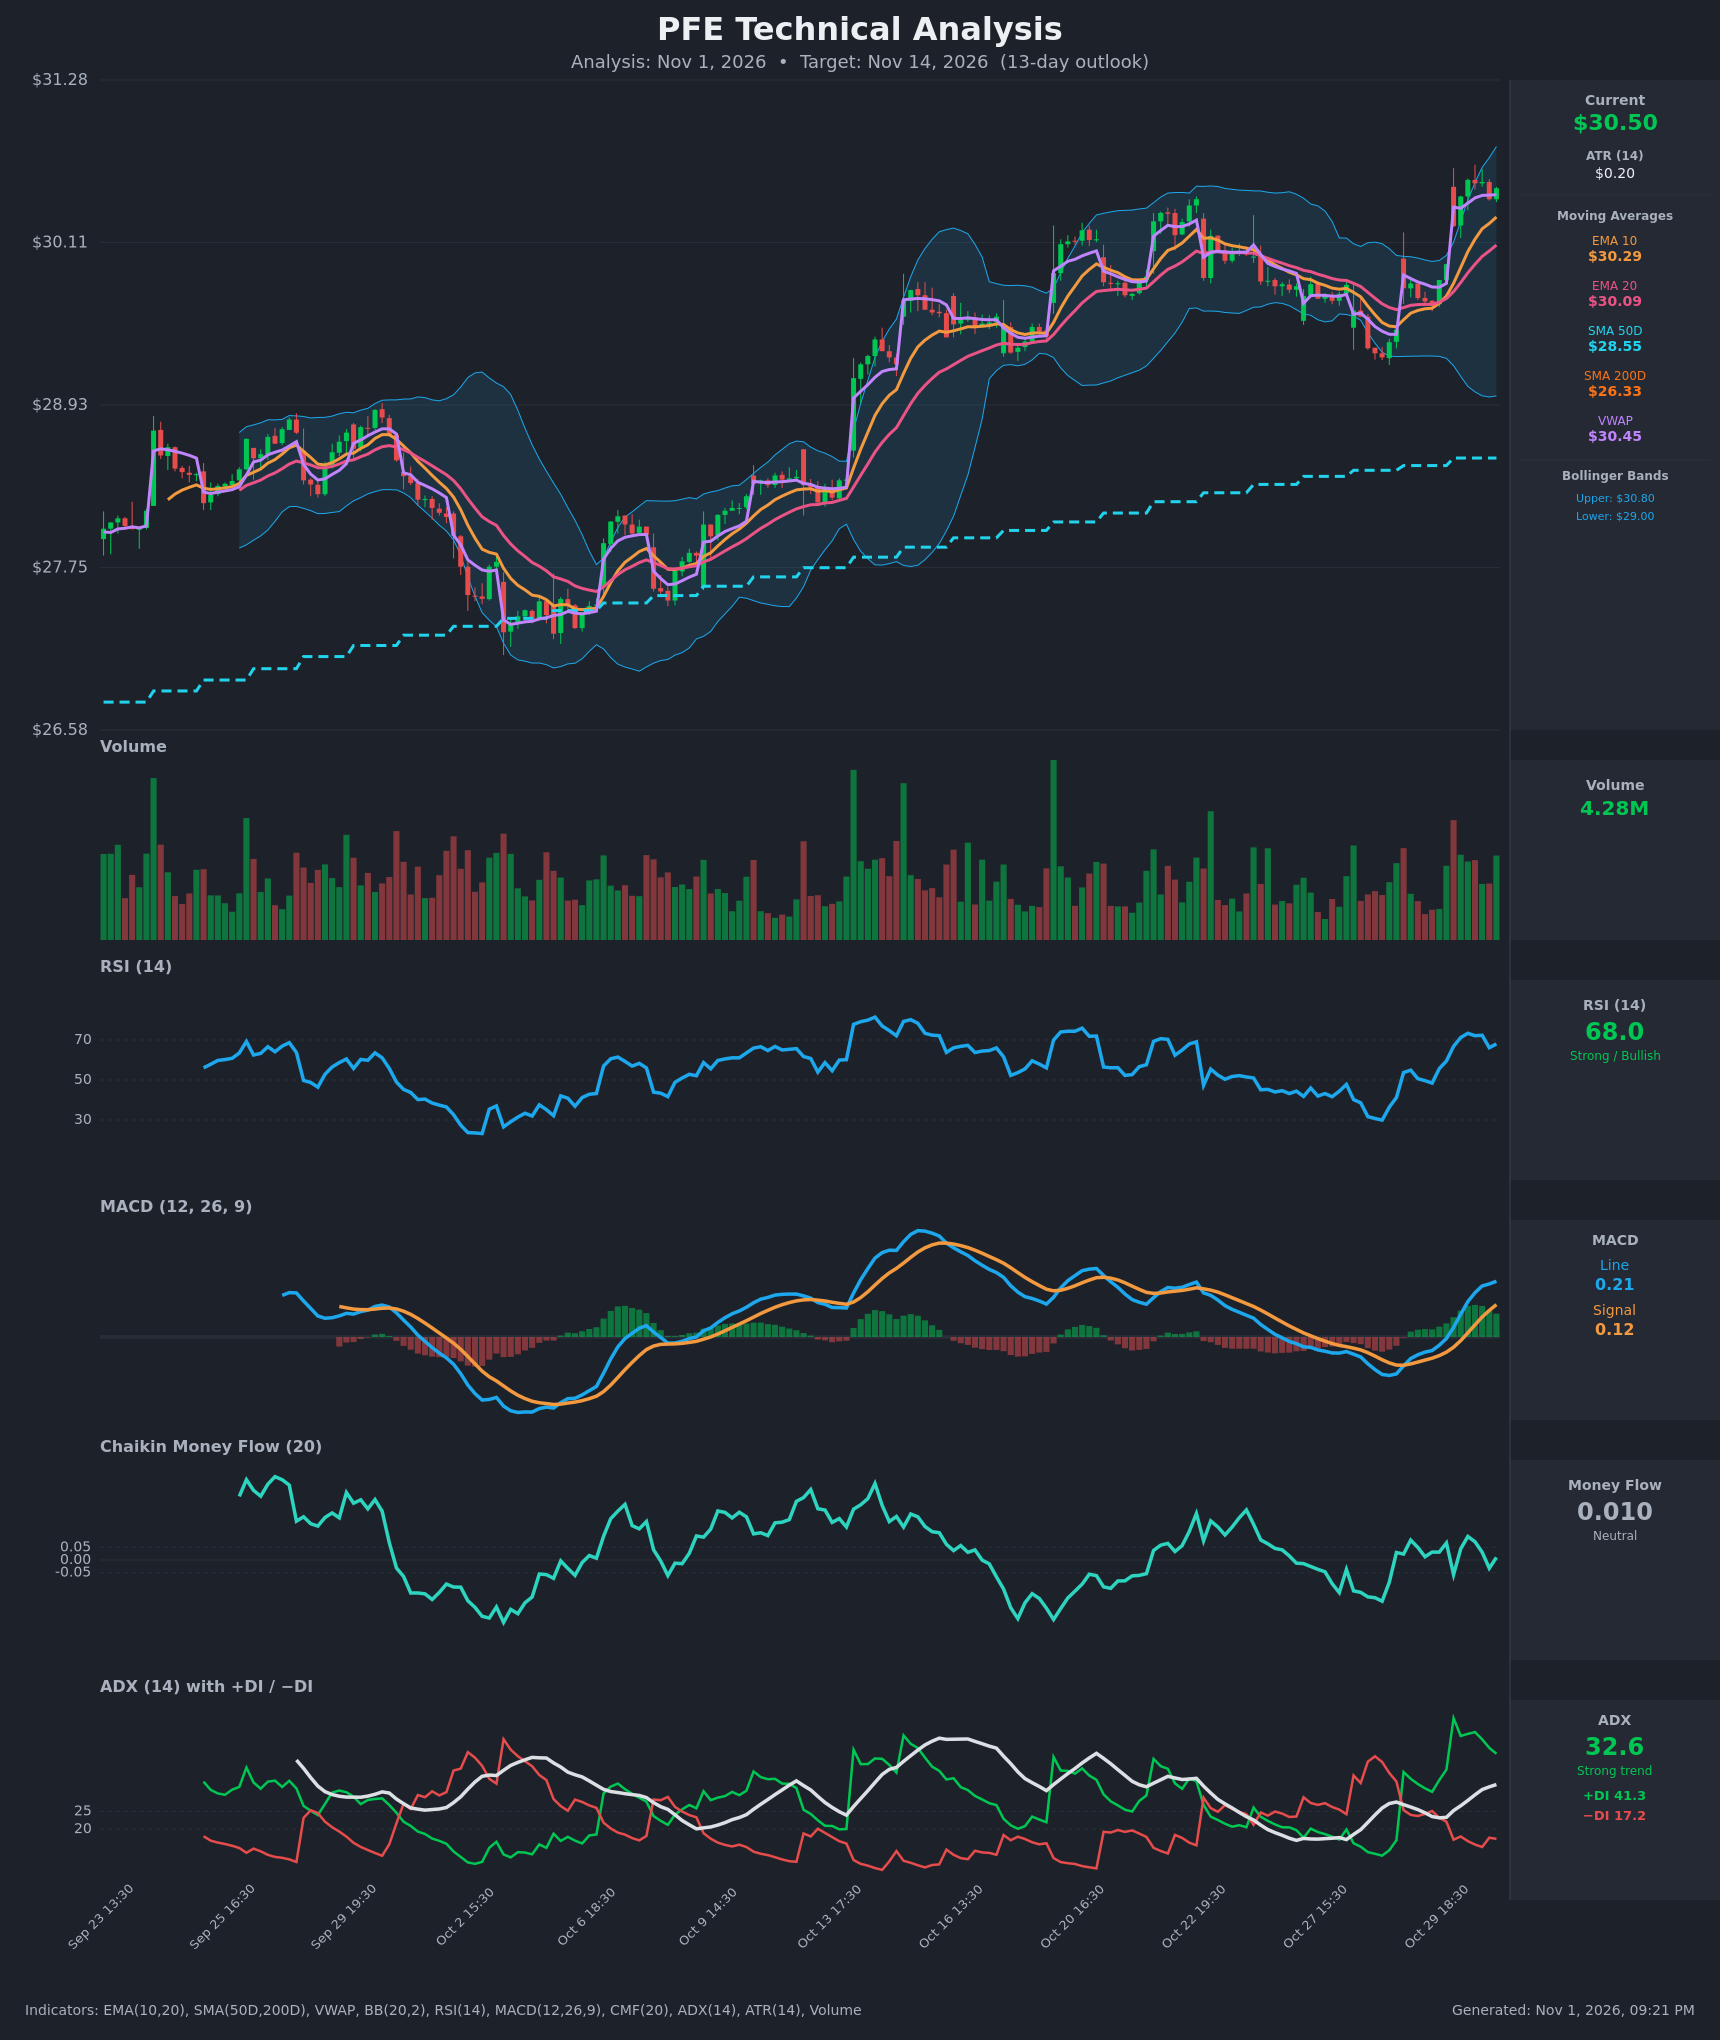
- RSI (14): 68.04, just below the 70 overbought line. It peaked at 73.3 on Oct 30 and has eased slightly. Momentum is strong after climbing from ~41 on Oct 28, but there is little room before overbought. [Bullish]
- 20 EMA: $30.09, with price ($30.50) about 1.4% above it. EMA10 ($30.29) is above EMA20 and both are rising, so dips toward $30.09–$30.29 should find support. [Bullish]
- MACD: Line 0.209 is above signal 0.122, and the histogram is positive and expanding. The bullish crossover happened around Oct 30 14:30–15:30, and the line is now at its highest in about two weeks. [Bullish]
- Bollinger Bands (20): Upper $30.80, lower $28.997, middle ~$29.90. Price is in the upper quarter of the band (~83% of the way up). The bands are starting to widen, which fits a volatility expansion and breakout, but price is nearing the upper band where short-term stalls are common. [Bullish]
- CMF (20): 0.010, inside the neutral zone (±0.05) and choppy. It has not confirmed the price breakout with real accumulation, which is a caution flag. [Neutral]
- ADX (14): 32.6 and rising, with +DI 41.3 well above −DI 17.2. This is a strong, established uptrend, and bulls have controlled since the Oct 29–30 DI crossover. [Strong Trend – Bullish]
- Volume: 4.28M on the latest bar, roughly average and not a surge. The breakout bars on Oct 30 had decent volume, but it is not decisive. VWAP ($30.45) is just below price, which is a mild buying-pressure signal. [Neutral to mildly Bullish]
DIVERGENCES & TRENDS
- RSI vs price: Price is roughly equal to its Oct 30 highs (~$30.56), but RSI has made a slightly lower peak (68 vs 73). This is a minor bearish divergence on the short-term bars, and it hints at a pause rather than a reversal.
- CMF vs price: Price is breaking out to a multi-week high, but CMF is flat near zero. Buying pressure is not confirming the move.
- Trend alignment: Price is above EMA10, EMA20, SMA50 ($28.55) and SMA200 ($26.33). SMA50 is above SMA200 (golden cross already in place), and the SMAs are rising.
- Crossovers: MACD crossed up on Oct 30, and +DI crossed above −DI on Oct 29. ADX has risen from ~23 to 32.6, so trend strength is increasing.
- Price action: Price made a sharp two-day rally from ~$29.65 to $30.56, a gain of about 3%, after a pullback to ~$29.2 in late October.
CHART PATTERNS
- Bullish Flag / Pennant (continuation): The Oct 22–28 pullback and tight consolidation, followed by an impulsive breakout, resembles a flag. The measured move projects roughly $31.2–$31.5.
- Range breakout / Triple-top risk: Price is testing the $30.55–$30.65 zone that capped rallies on Oct 20–22. A close above ~$30.65 with follow-through would confirm the breakout, with BB upper at $30.80 as the first hurdle.
- Bearish Double Top risk: A rejection at ~$30.6 followed by a drop below $30.09 would turn this into a failed breakout and open $29.3–$29.5.
- Ascending Triangle (loose): Higher lows since Oct 2 against horizontal resistance at ~$30.6 are consistent with an upside resolution.
POTENTIAL SCENARIOS
- Scenario 1: Bullish Breakout Continuation — The strong trend (ADX 32.6, +DI dominant) pushes price through $30.60–$30.80 after a brief digestion, using EMA10 as support. Trigger: a daily close above $30.80 with volume above 4.5M. Target: $31.30–$31.60. Invalidation: a close below $30.09 (EMA20). (50% probability)
- Scenario 2: Neutral Overbought Consolidation — RSI cools from ~68 while price chops between EMA20 and the upper Bollinger Band, and MACD flattens. Trigger: repeated rejection near $30.60–$30.80 without a break below $30.09. Target: $30.10–$30.70 range. Invalidation: a break above $30.85 or below $29.90. (30% probability)
- Scenario 3: Bearish Failed Breakout — The RSI divergence and flat CMF lead to a double-top rejection, and the late-October gains unwind. Trigger: a close below $30.09 on rising volume. Target: $29.50, then the ~$29.00 lower band. Invalidation: a reclaim of $30.60. (20% probability)
PRICE TARGETS
- Target Price: $30.95 (13-day horizon)
- Expected Range: $29.35 to $31.75 (width $2.40 ≈ 7.9% of current price, consistent with a ~2-week horizon)
- Key Levels: Support at $30.09 (EMA20), with deeper support at $29.35. Resistance at $30.80 (BB upper), with a higher zone at $31.50.
OVERALL BIAS
OVERALL BIAS: BULLISH - A strong ADX-confirmed uptrend (+DI 41 vs −DI 17), a fresh MACD bullish crossover, and price above all key moving averages favor upside continuation. The mild RSI divergence, near-overbought RSI and neutral CMF argue for modest conviction and a possible pause near $30.80.
This is educational analysis and not financial advice.