QUBT 13-day bullish forecast — Nov 1, 2026
- Bias: Bullish
- Timeframe: 13 days (made Nov 1, 2026, target date Nov 13, 2026)
- Price at analysis: $6.60
- Price target: $6.78
- Expected range: $6.25 – $6.95
- Result: Incorrect (-15.8%) — closed at $5.56 on Nov 13, 2026; quality score 0/100
Get a free AI analysis of QUBT today
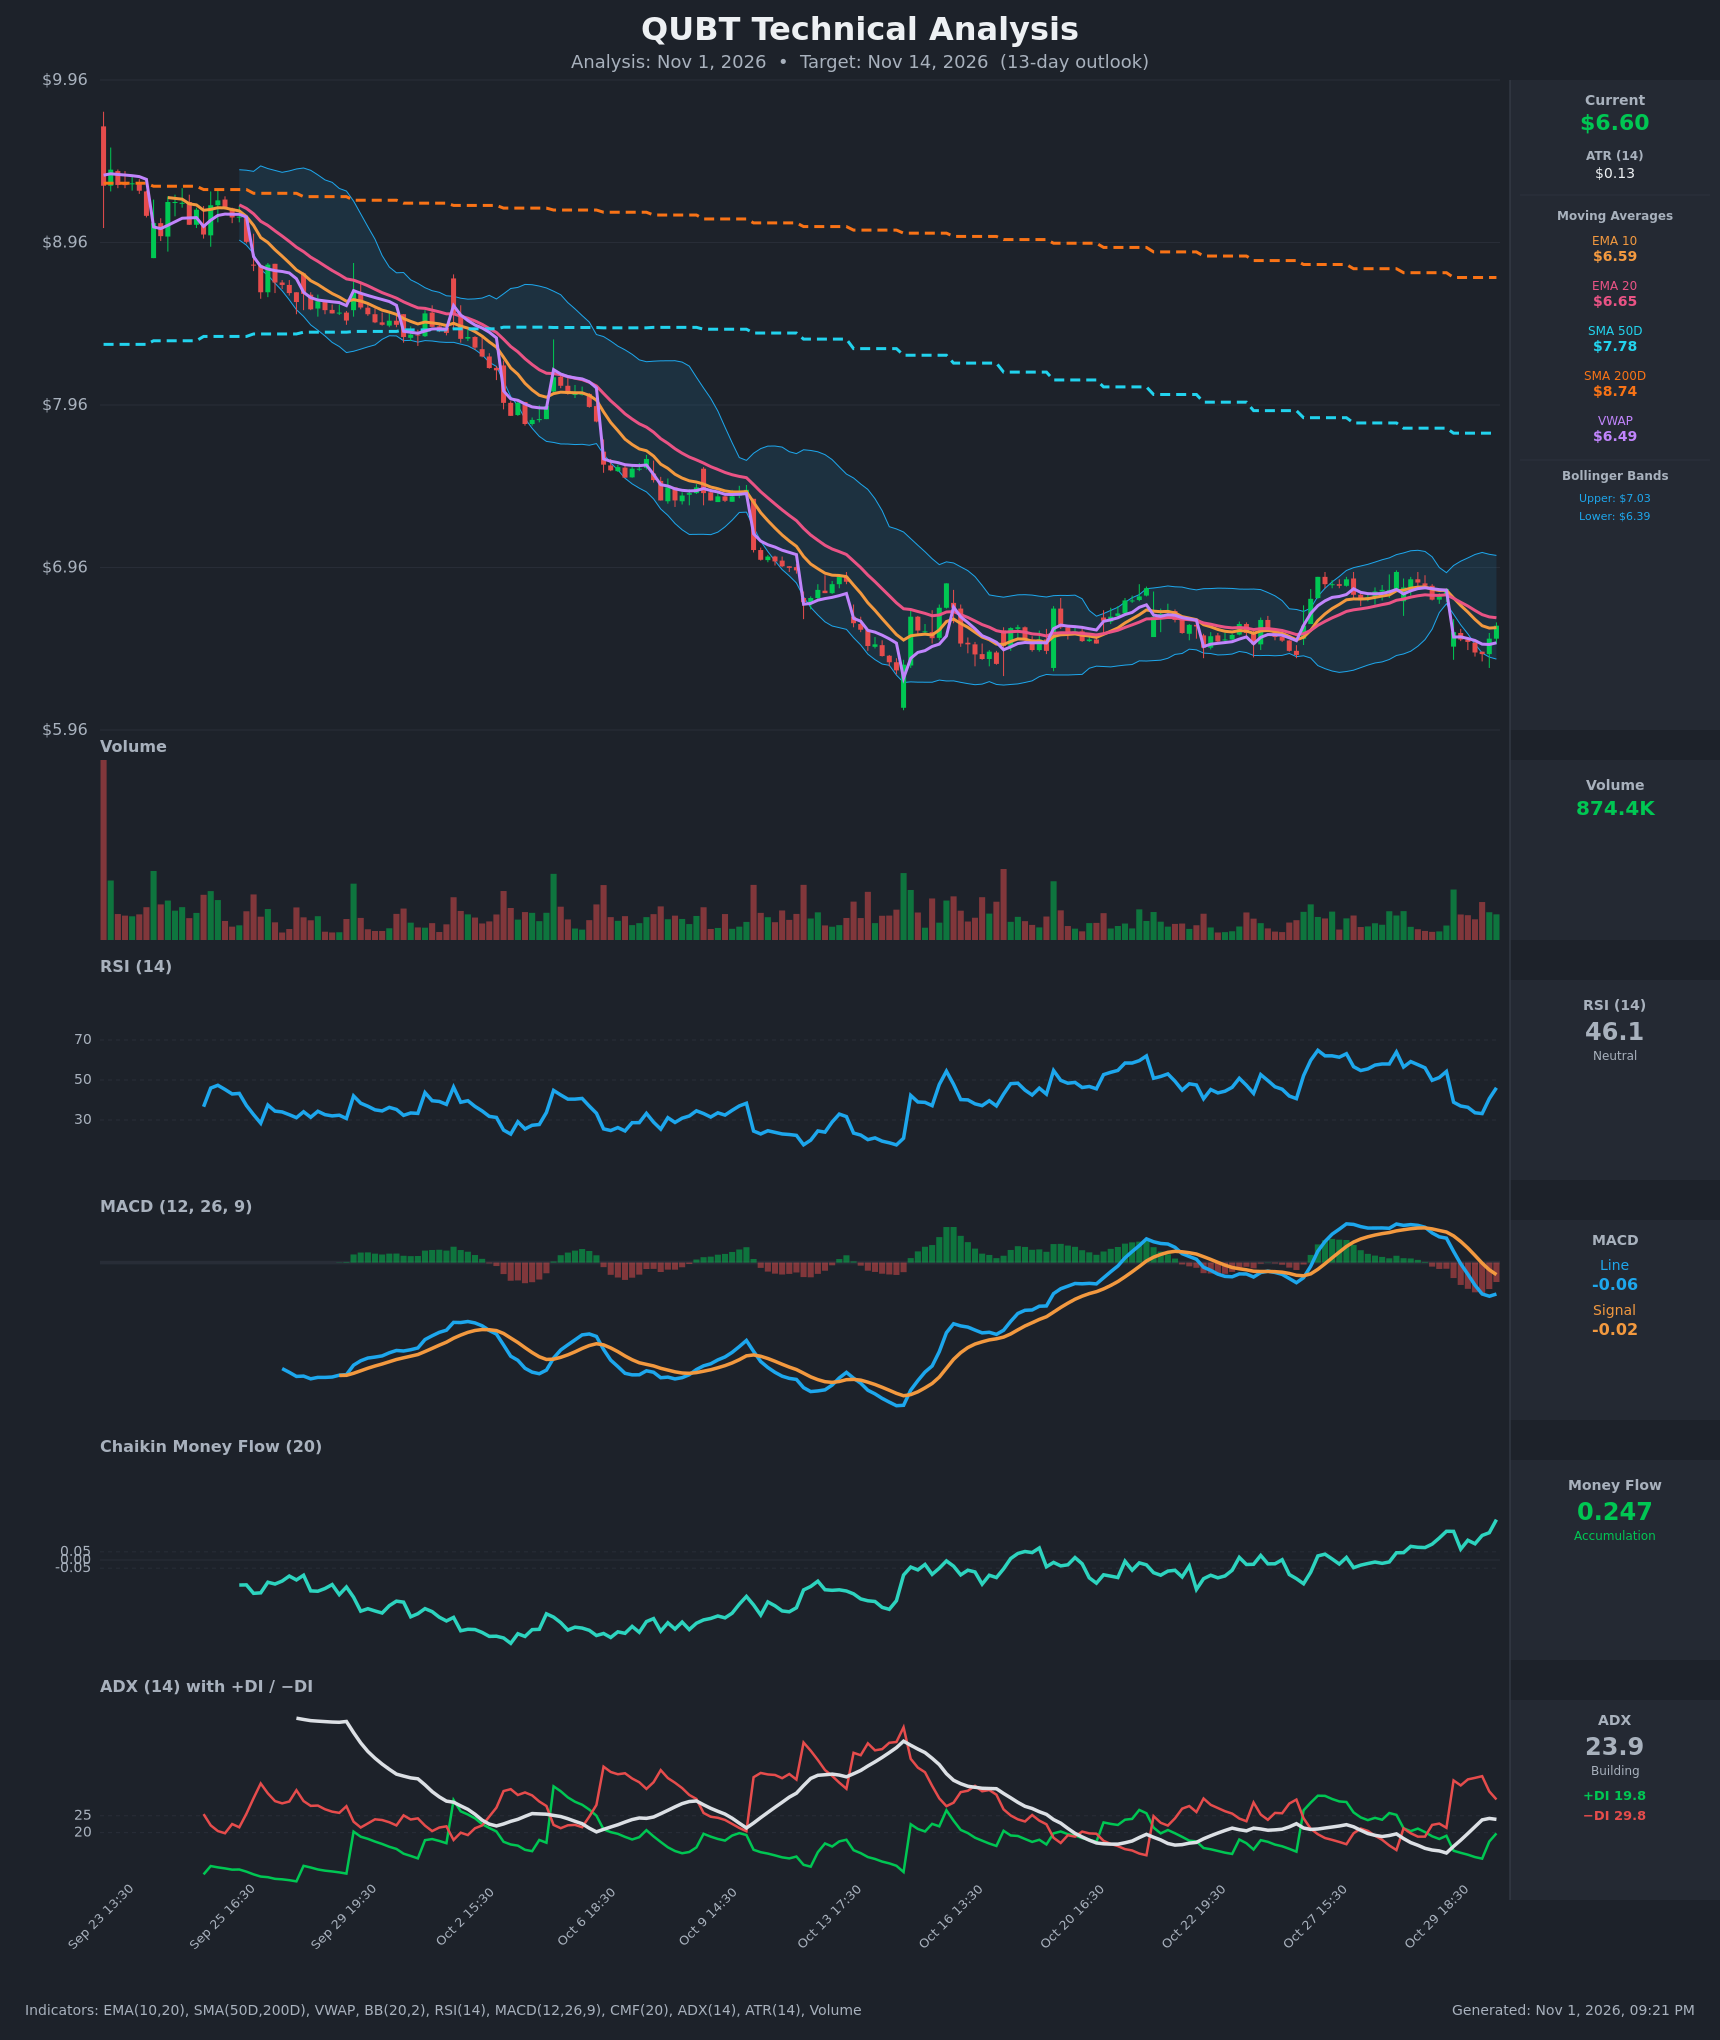
Analysis
TECHNICAL INDICATORS
- RSI (14): 46.11, rebounding from 33.2 at the Oct 30 17:30 low. It is just under the 50 midline, and momentum is turning up after a brief oversold-adjacent dip. [Neutral]
- 20 EMA: $6.65 (EMA10 at $6.59). Price at $6.60 is just below the EMA20 and just above the EMA10. EMA10 sits below EMA20 after rolling over on Oct 30, so the short-term cross is bearish. The EMA20 is the first resistance. [Bearish]
- MACD: Line -0.056 is below Signal -0.022, and the histogram is negative. The line crossed below the signal on Oct 30 and is starting to flatten. Momentum is bearish but fading. [Bearish]
- Bollinger Bands (20): Upper $7.03, lower $6.39, so price sits in the lower-middle of the band at about 33% of the width. The bands have narrowed from the earlier selloff. The Oct 30 low (~$6.42) tagged the lower band and bounced, which fits range-style mean reversion. [Neutral]
- CMF (20): 0.247 and rising to the highest level on the chart, well above +0.05. It has been positive since mid-October while price went sideways, so buyers are absorbing supply. [Accumulation]
- ADX (14): 23.9 with +DI 19.8 and −DI 29.8. −DI is on top, so the trend is mildly bearish. ADX is just under 25 and was lifted by the Oct 30 drop. +DI is turning back up and −DI is rolling over from 36.7. [Moderate Trend, Bearish bias]
- Volume: 874.4K, near average. There was a modest spike on the Oct 30 gap-down, but volume has been muted during the 2-week base. Selling has not been heavy, which supports a base rather than a fresh breakdown. [Neutral to mildly supportive of a base]
Moving averages and VWAP:
- Price is below the SMA50 ($7.78) and SMA200 ($8.74). The SMA50 is already below the SMA200, so the death cross is in place and the long-term trend is down.
- Price is above VWAP ($6.49), a modest sign of buyer support.
DIVERGENCES & TRENDS
- Bullish CMF divergence: CMF has climbed from about -0.2 in early October to +0.247 while price made a lower low and then went sideways. This points to quiet accumulation.
- RSI: It did not confirm the Oct 30 low in price in any dramatic way. It bottomed at 33 and is rising, which is a modest bounce signal.
- MACD: The bearish crossover on Oct 30 is a recent negative. The histogram has stopped deepening, so the bearish momentum is likely close to exhaustion.
- DI: −DI has dominated since the Oct 30 gap-down, but the gap is narrowing (35.5 → 29.8 for −DI, 14.6 → 19.8 for +DI).
- Trend structure: The long-term trend is clearly down, with price well below the declining SMA50 and SMA200. Since about Oct 14, price has based in a $6.30–$6.95 range.
CHART PATTERNS
- Primary pattern: A sideways base or rectangle at the lows after a long decline, roughly $6.30–$6.95. It resembles the Bullish Triple Top/Bottom (range) structure in the reference diagram, with repeated tests of support near $6.30–$6.40 and resistance near $6.90.
- Secondary read: The long downtrend followed by a base with accumulation is a potential reversal setup. A bullish resolution needs a break above $6.95–$7.03, which would target about $7.60 (the range height of roughly $0.65 projected up).
- Bearish alternative: A failed base would break below $6.30. That would be a continuation of the long downtrend, with a measured target near $5.70–$5.95.
- Pattern significance: The pattern is not yet confirmed either way. For a 13-day window, the likeliest outcome is a drift within the range rather than a full breakout.
POTENTIAL SCENARIOS
- Scenario 1: Bullish Range Bounce Toward Upper Band — CMF accumulation and the RSI rebound lift price back above the EMA20 and toward the upper half of the range. Trigger: close above the EMA20 ($6.65) and a MACD histogram turn. Target: $6.90–$7.00. Invalidation: close below $6.39 (lower band). (45% probability)
- Scenario 2: Bearish Breakdown Continuation — The long-term downtrend resumes. −DI stays dominant and the MACD bearish crossover extends. Price loses the lower band and the range low. Trigger: close below $6.30 on rising volume. Target: $5.95–$6.10. Invalidation: reclaim of $6.75. (30% probability)
- Scenario 3: Neutral Chop in Range — Price oscillates between $6.35 and $6.80 with no resolution. Trigger: failure to clear the EMA20 and the lower band holding. Target: $6.50–$6.70. Invalidation: a decisive close outside $6.30–$6.95. (25% probability)
PRICE TARGETS
For the 13-day horizon, using the 14-day-style guidance of roughly 8–12% width:
- Target Price: $6.78 (+2.7% from $6.60)
- Expected Range: $6.25 to $6.95 (width $0.70, about 10.6% of price, which fits the 13-day guidance)
- Key Levels: Support at $6.39, Resistance at $6.90
OVERALL BIAS
OVERALL BIAS: BULLISH - The strong, rising CMF (0.247) shows accumulation, and RSI is rebounding from near-oversold. Price is holding above VWAP at the bottom of a 2-week base. Bearish risks remain from the MACD cross, −DI dominance and the death-cross backdrop, so conviction is modest.
This is educational analysis and not financial advice.