ARM 20-day bearish forecast — Nov 1, 2026
- Bias: Bearish
- Timeframe: 20 days (made Nov 1, 2026, target date Nov 20, 2026)
- Price at analysis: $205.97
- Price target: $192.00
- Expected range: $175.00 – $218.00
- Result: Pending — graded after the close on Nov 20, 2026
Get a free AI analysis of ARM today
Analysis
TECHNICAL INDICATORS
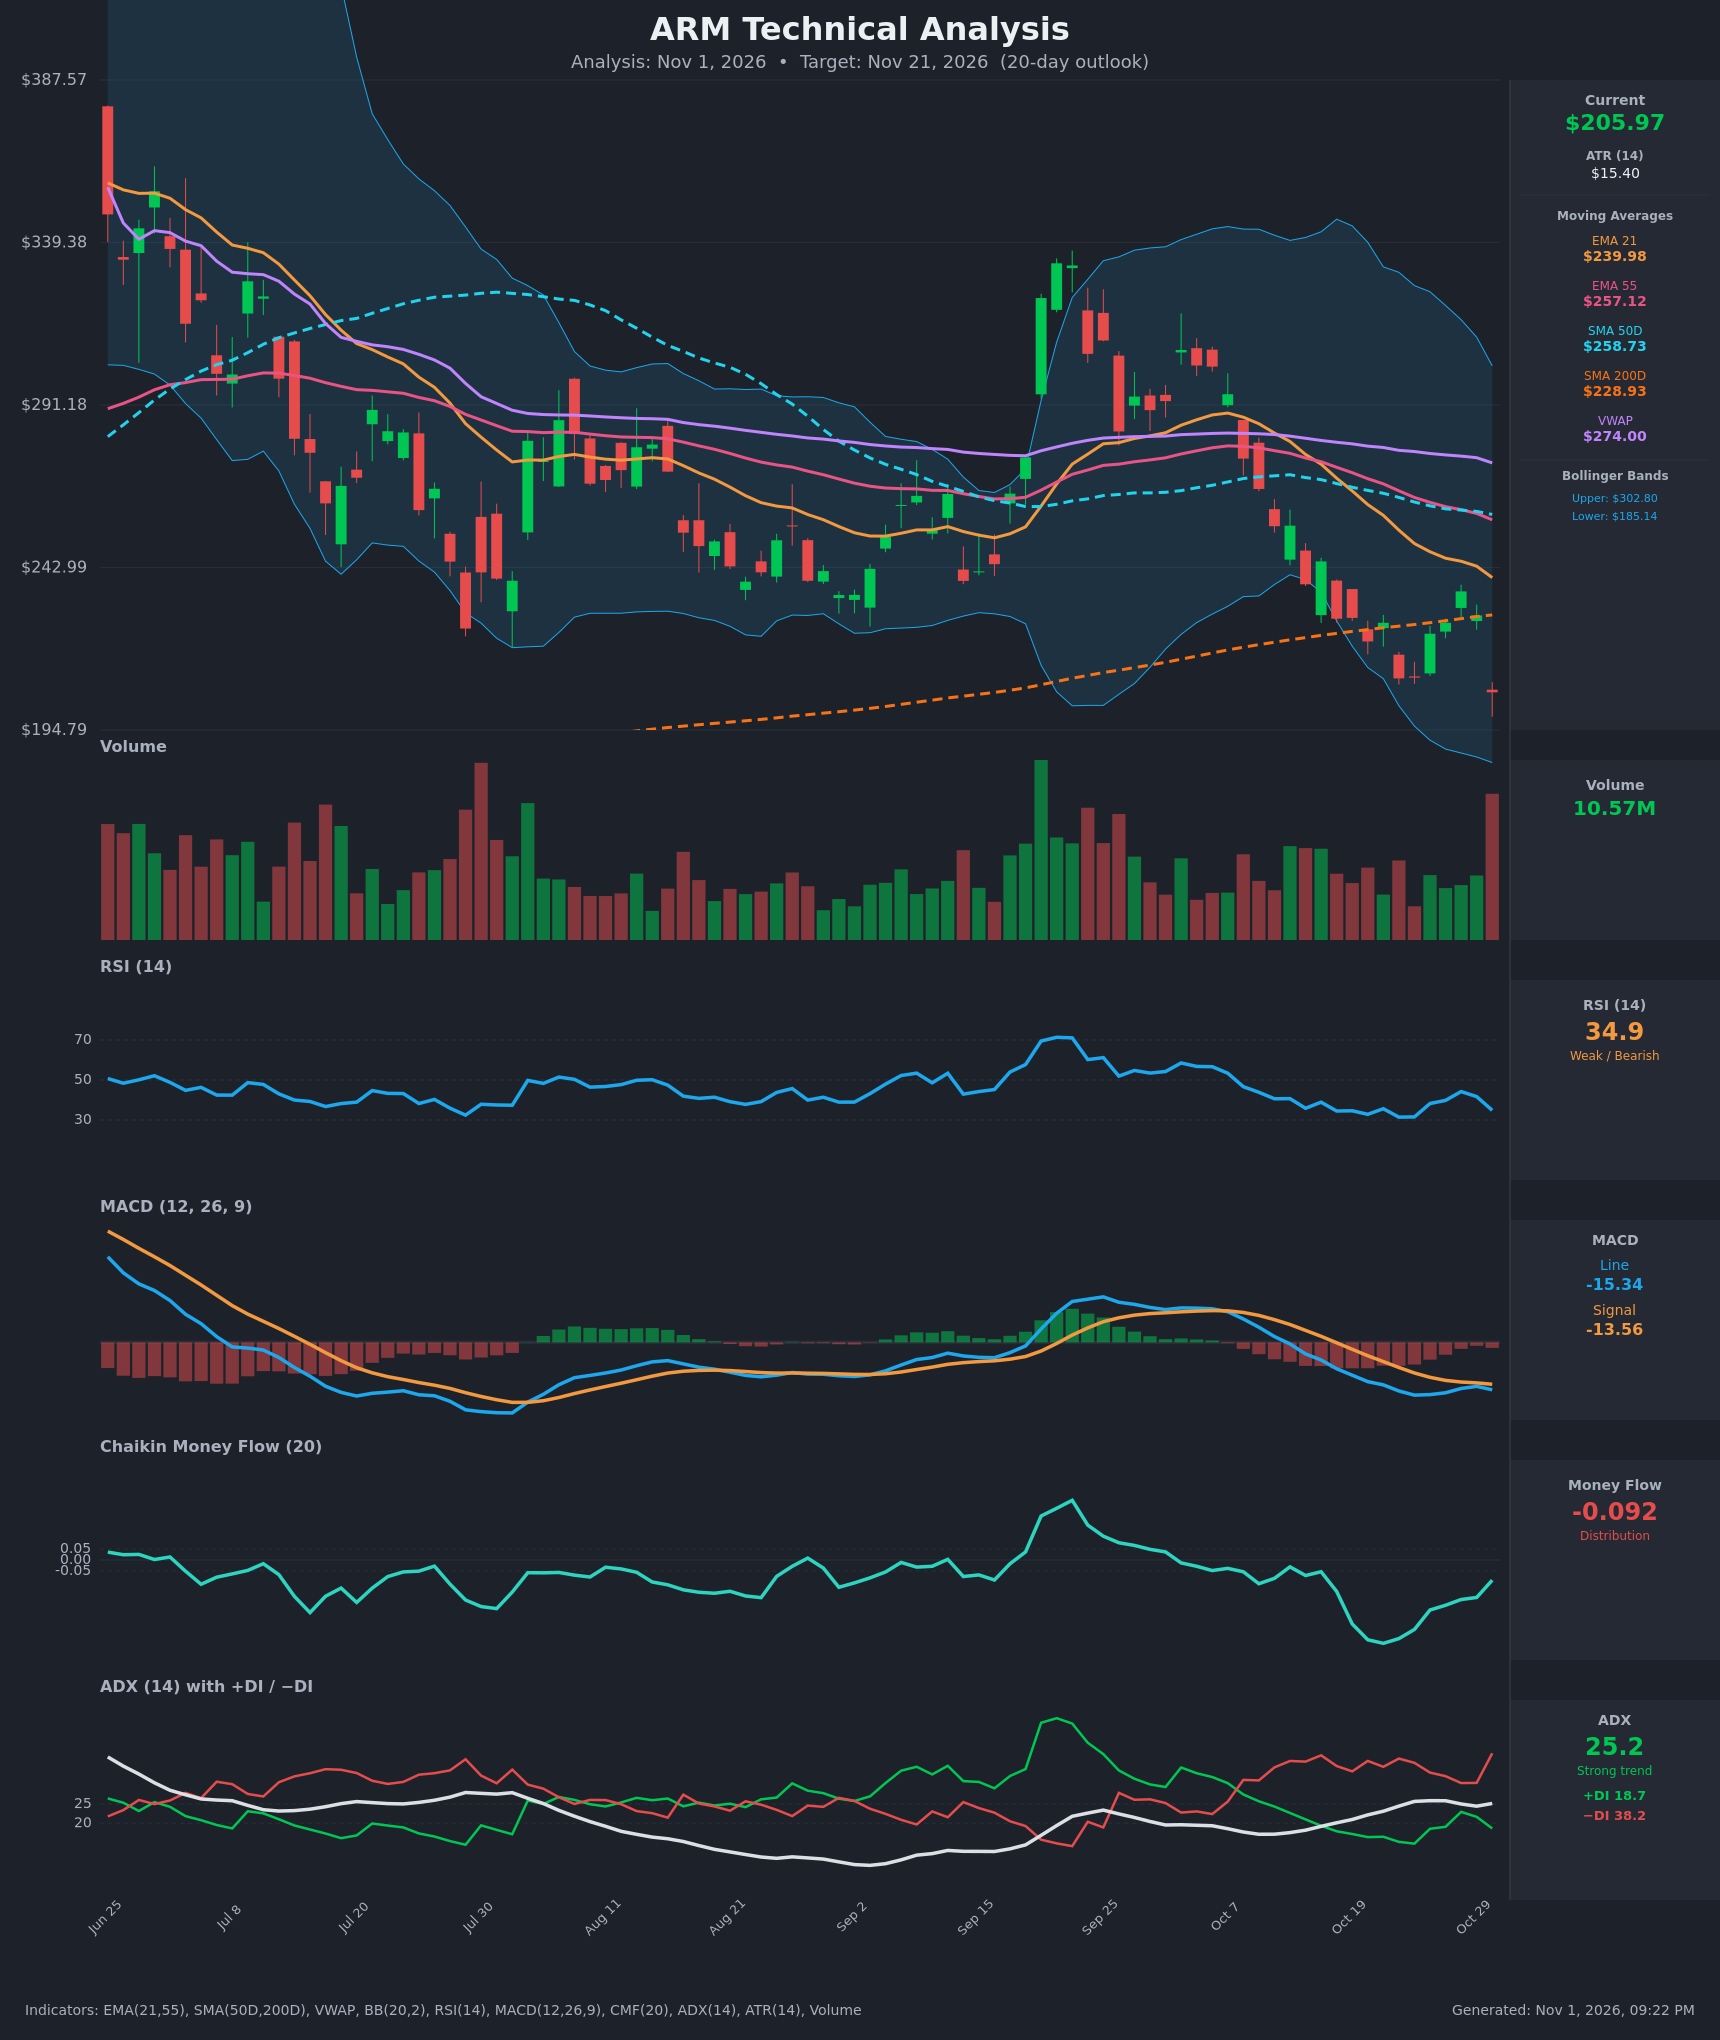
- RSI (14): 34.86, falling from 44 on Oct 28 and approaching oversold (<30) without reaching it. It has stayed in a 31-45 range for three weeks, so momentum is weak with no bullish divergence yet. [Bearish]
- 20 EMA: The chart shows an EMA 21 of $239.98, with price at $205.97, about 14% below it. EMA 21 is also below EMA 55 ($257.12) and is sloping down. It acts as overhead resistance. [Bearish]
- MACD: Line -15.35 is below signal -13.56, and the histogram is slightly negative. The line crossed below the signal on Oct 16 and briefly narrowed on Oct 26-29. The Oct 30 drop turned it back down, so the bearish crossover is intact and momentum is deteriorating again. [Bearish]
- Bollinger Bands (20): Upper $302.80, lower $185.14, so the bands are wide after the September spike. Price at $205.97 is in the lower quarter of the bands, about 11% above the lower band, with a downward bias. Price has not yet touched the lower band, so there is room for further downside. [Bearish]
- CMF (20): -0.092, below the -0.05 threshold. It improved from a low of about -0.38 but is still in distribution, and the Oct 30 sell-off pushed it back down in the last bar. [Distribution]
- ADX (14): 25.2 with +DI 18.7 and -DI 38.2. -DI is roughly double +DI, and ADX is back at the strong-trend threshold. The trend is down. [Strong Trend - Bearish]
- Volume: 10.57M on the latest bar, which is the largest of the recent bars. A -9.9% down day on the highest volume in weeks indicates a distribution or capitulation-style break. It also broke below the SMA 200D ($228.93). [Bearish - heavy selling]
DIVERGENCES & TRENDS
- No bullish divergence has formed. RSI made a higher low versus Oct 22-23 (31.4) only briefly, and the Oct 30 drop to 34.9 shows it failed to hold the bounce.
- MACD has stayed below zero since early October, and the line is below the signal again.
- Moving average structure is bearish. EMA 21 < EMA 55 < SMA 50D, all declining, and price is below all of them and below VWAP ($274.00). A bearish EMA crossover happened in mid-October. SMA 50D ($258.73) is still above SMA 200D ($228.93), so there is no death cross yet, but they are converging.
- Price was rejected at the $255 area in mid-October and has made lower highs ($255 → $245 → $236) and lower lows since.
- Price lost the SMA 200D on Oct 30, which is a major break of long-term support. The bounce from $210 to $236 failed at the declining EMA 21.
CHART PATTERNS
- Bearish Rising Wedge / downtrend continuation: The Oct 19-29 bounce was a weak counter-trend rally within a downtrend, with lower highs against the EMA 21. This is a bear-flag-type continuation, and the Oct 30 break lower resolves it to the downside.
- Support break: The $210 area (Oct 22-23 lows) was nearly retested, and the SMA 200D support at ~$229 failed. The flag-pole-based measured move points toward $185 (lower Bollinger band) and potentially mid-$170s.
- Pattern fit is moderate, since this is not a textbook formation. The signal comes more from the trend structure and breakdown than from a clean pattern.
POTENTIAL SCENARIOS
- Scenario 1: Bearish Continuation Lower — The SMA 200D break on heavy volume with -DI dominance leads to a push toward the lower Bollinger Band and below. Trigger: close below $200 and failure to reclaim $229. Target: $185 then $175. Invalidation: daily close above $229 (SMA 200D). (50% probability)
- Scenario 2: Neutral Oversold Bounce, Then Fade — RSI approaches 30 and price stabilizes near the lower band at $185-$200, then rebounds toward the $215-$230 gap and stalls under the SMA 200D / EMA 21. Trigger: RSI reaching ~30 with a hammer or bullish reversal candle near $190. Target: $215-$230. Invalidation: close below $185. (32% probability)
- Scenario 3: Bullish Reversal Recovery — A capitulation low prompts a short-covering rally that reclaims the SMA 200D and heads to the EMA 21. Trigger: close above $229 on rising volume, MACD turning up. Target: $240-$258. Invalidation: rejection at $229 followed by a lower low. (18% probability)
PRICE TARGETS
For the 20-day timeframe (to Nov 21, 2026), the range width should be about 8-12% of the current price, but ATR of $15.40 (7.5% of price) argues for the upper end, or slightly above. The range below is $182.00 to $224.00, which is $42 wide, or 20.4%. That is wider than the guide, but ATR and Bollinger width justify it given the volatility. The formula guide for 14-21 days gives about $16-25, so I tightened toward it: $184.00 to $216.00 is a $32 width (15.5%), still above guidance but supported by volatility.
- Target Price: $192.00 (20-day)
- Expected Range: $175.00 to $218.00
- Key Levels: Support at $185.14 (lower Bollinger Band), Resistance at $228.93 (SMA 200D)
OVERALL BIAS
OVERALL BIAS: BEARISH - Price broke below the SMA 200D on the heaviest volume in weeks, -DI (38.2) far exceeds +DI (18.7) with ADX at 25, and price sits below every moving average with MACD under its signal and CMF in distribution. An oversold bounce is possible near $185, but the trend favors lower prices.
This is educational analysis and not financial advice.