SLV 13-day bearish forecast — Nov 1, 2026
- Bias: Bearish
- Timeframe: 13 days (made Nov 1, 2026, target date Nov 13, 2026)
- Price at analysis: $44.57
- Price target: $43.20
- Expected range: $41.00 – $45.40
- Result: Correct (-1.0%) — closed at $44.13 on Nov 13, 2026; quality score 100/100
Get a free AI analysis of SLV today
Analysis
TECHNICAL INDICATORS
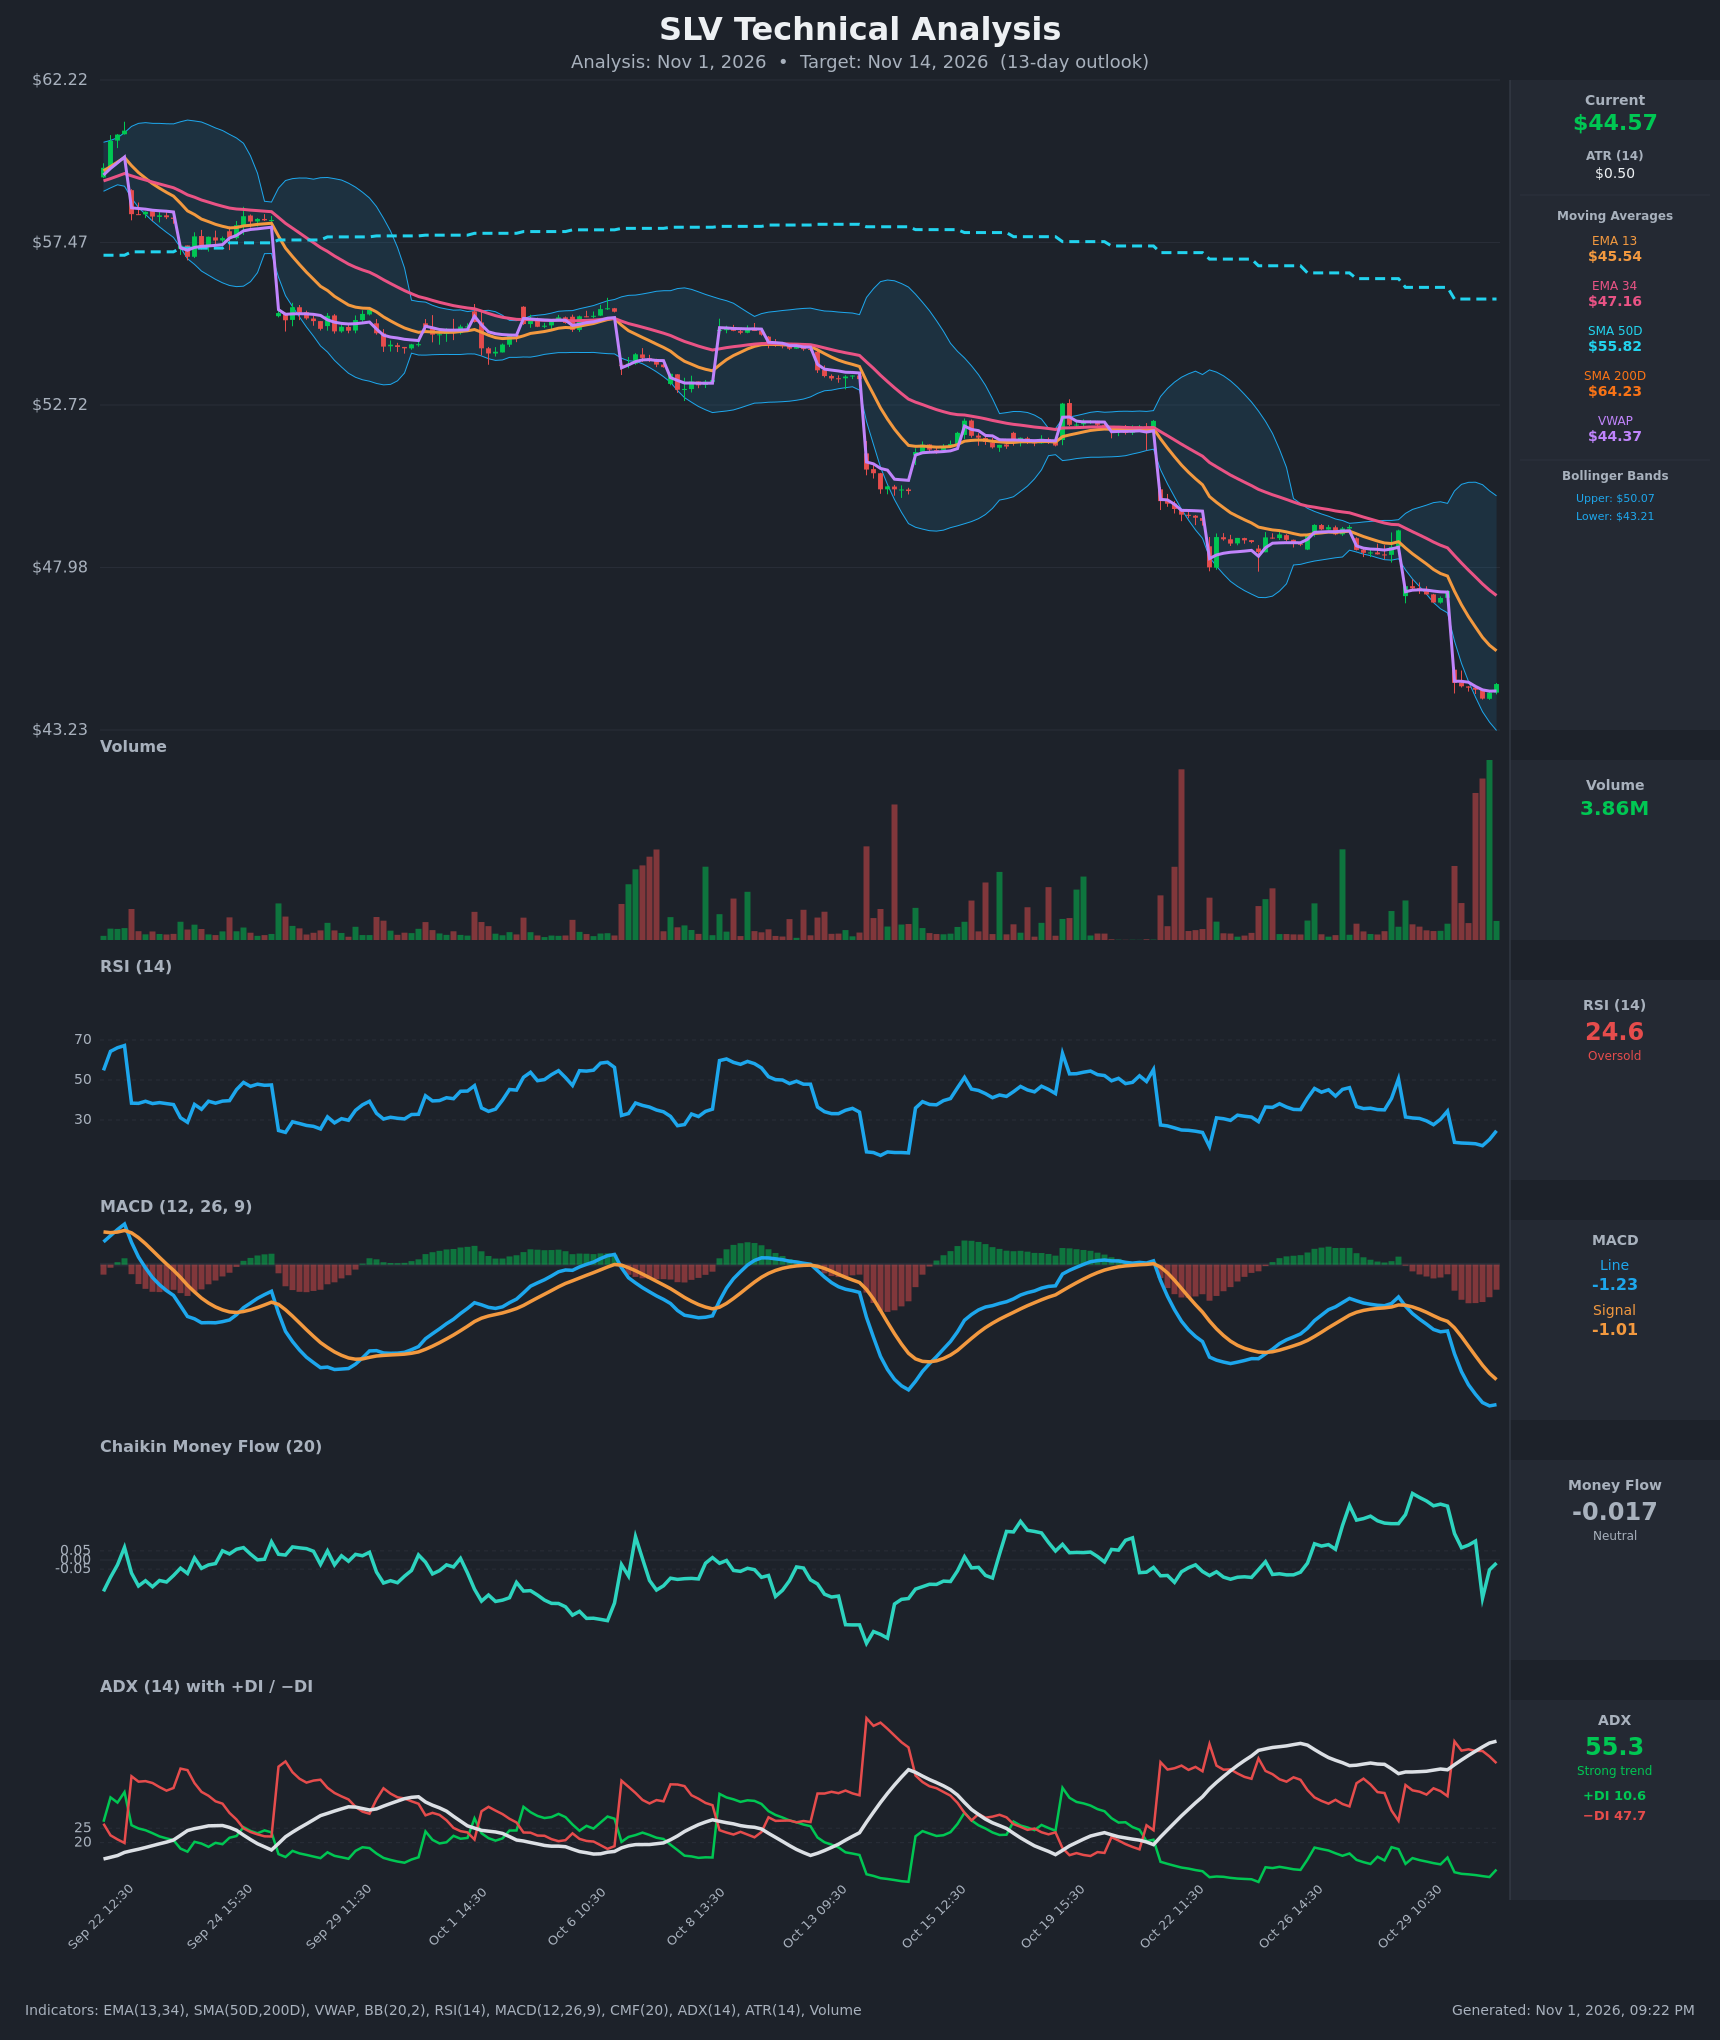
- RSI (14): 24.61, oversold. It printed a low of about 17.2 on Oct 30 and has ticked up to the mid-20s. That is only a small bounce from an extreme low, and RSI is still below 30 and has not yet shown a higher-low divergence. [Bearish]
- 20 EMA: The data gives EMA 13 at $45.54 and EMA 34 at $47.16. Price ($44.57) is below both. EMA 13 sits below EMA 34 and the gap is widening, so both act as overhead resistance. [Bearish]
- MACD: The line (-1.23) is below the signal (-1.01), with the histogram negative and expanding. The bearish crossover was in place by Oct 29 and the spread keeps widening. Momentum is still pointing down, with no sign of flattening. [Bearish]
- Bollinger Bands (20): The bands are $43.21 to $50.07. Price is at $44.57 in the lower quarter of the band after riding the lower band lower. The bands are expanding, which confirms high volatility in the downtrend. A stretch this far below the mean raises the odds of a relief bounce, but a "walk" down the lower band is typical of strong trends. [Bearish]
- CMF (20): -0.017, inside the ±0.05 neutral zone. It has dropped sharply from +0.36 earlier in the week. Buying pressure has faded, but outright distribution is not confirmed. [Neutral]
- ADX (14): 55.3 and rising, a very strong trend. −DI (47.7) is far above +DI (10.6), so bears are in clear control. An ADX above 50 can also signal late-stage trend exhaustion, which tempers conviction. [Strong Trend – Bearish]
- Volume: 3.86M. The final bars show the heaviest volume on the chart, which looks like a selling climax or capitulation. Heavy volume on a breakdown confirms the move, but it can also mark a short-term exhaustion low. [Capitulation / Bearish confirmation]
DIVERGENCES & TRENDS
- There is no bullish RSI or MACD divergence yet. Price made a new low while RSI (about 17–25) and MACD (-1.23) also made new lows, so the indicators confirm the price action.
- A death cross is already in force, with SMA50D ($55.82) well below SMA200D ($64.23). Price is about 20% below SMA200D and about 20% below SMA50D, a deeply stretched, long-term downtrend.
- EMA 13 is below EMA 34, which is below SMA50D, which is below SMA200D. This is a fully bearish stack.
- Price is at VWAP ($44.37), so the trade-weighted average is flush with the market. Price barely holds above it, which gives no meaningful support.
- The stair-step pattern of gap-downs (Oct 22, Oct 29–30) followed by tight consolidation shows persistent selling.
- CMF has rolled over from the high positive readings, and RSI shows an early uptick from deep oversold. These are the first hints of a relief bounce.
CHART PATTERNS
- The chart shows a steep descending channel / series of bearish flags and pennants (like the Bearish Flag and Bearish Pennant patterns in the reference). Each tight consolidation has resolved down with a gap, and this continuation pattern keeps repeating.
- The latest leg broke below the prior consolidation near $47. Measured-move logic puts the next downside objective around $42–43 (the lower Bollinger Band and the next psychological area).
- A Bullish Falling Wedge or exhaustion bounce is a possible alternative if price can reclaim EMA 13 ($45.54). It is not confirmed. The upside of a bounce is limited to gap-fill and EMA resistance around $46–47.3.
POTENTIAL SCENARIOS
- Scenario 1: Bearish Trend Continuation — The ADX of 55 with −DI dominance, a widening MACD spread and a price-below-everything stack argue for further grinding lower after a brief pause. Trigger: failure to reclaim EMA 13 ($45.54) and a break below the lower Bollinger Band ($43.21). Target: $43.20, with an extension to $41.50. Invalidation: a daily close above $46.50. (50% probability)
- Scenario 2: Bullish Oversold Relief Bounce — RSI near 17–25 on climactic volume could produce a mean-reversion rally toward the gap and the EMAs. Trigger: a close above EMA 13 ($45.54) with RSI back above 35 and CMF turning positive. Target: $46.80 to $47.30 (the Oct 29–30 gap and EMA 34). Invalidation: a break below $43.20. (38% probability)
- Scenario 3: Neutral Basing Range — Price stabilizes after the capitulation and chops between $43.20 and $46. Trigger: ADX rolls over and the lower band holds. Target: about $44.50. Invalidation: a close outside $43.00–$46.50. (12% probability)
PRICE TARGETS
- Target Price: $43.20 (13-day horizon)
- Expected Range: $41.00 to $45.40 (width $4.40, about 9.9% of the current price, consistent with the 8–12% guidance for 14–21 days and appropriately wider than a 2–3 day range)
- Key Levels: Support at $43.21 (lower Bollinger Band), Resistance at $45.54 (EMA 13), with the next resistance at $47.16 (EMA 34)
OVERALL BIAS
OVERALL BIAS: BEARISH - The strong downtrend (ADX 55, −DI 47.7 vs +DI 10.6), the negative MACD and the death-cross, below-all-MAs structure outweigh the oversold RSI. Heavy-volume capitulation raises the risk of a sharp relief bounce, so conviction is moderate.
This is educational analysis and not financial advice.