EEM 20-day bearish forecast — Nov 1, 2026
- Bias: Bearish
- Timeframe: 20 days (made Nov 1, 2026, target date Nov 20, 2026)
- Price at analysis: $61.04
- Price target: $59.60
- Expected range: $56.60 – $63.30
- Result: Pending — graded after the close on Nov 20, 2026
Get a free AI analysis of EEM today
Analysis
TECHNICAL INDICATORS
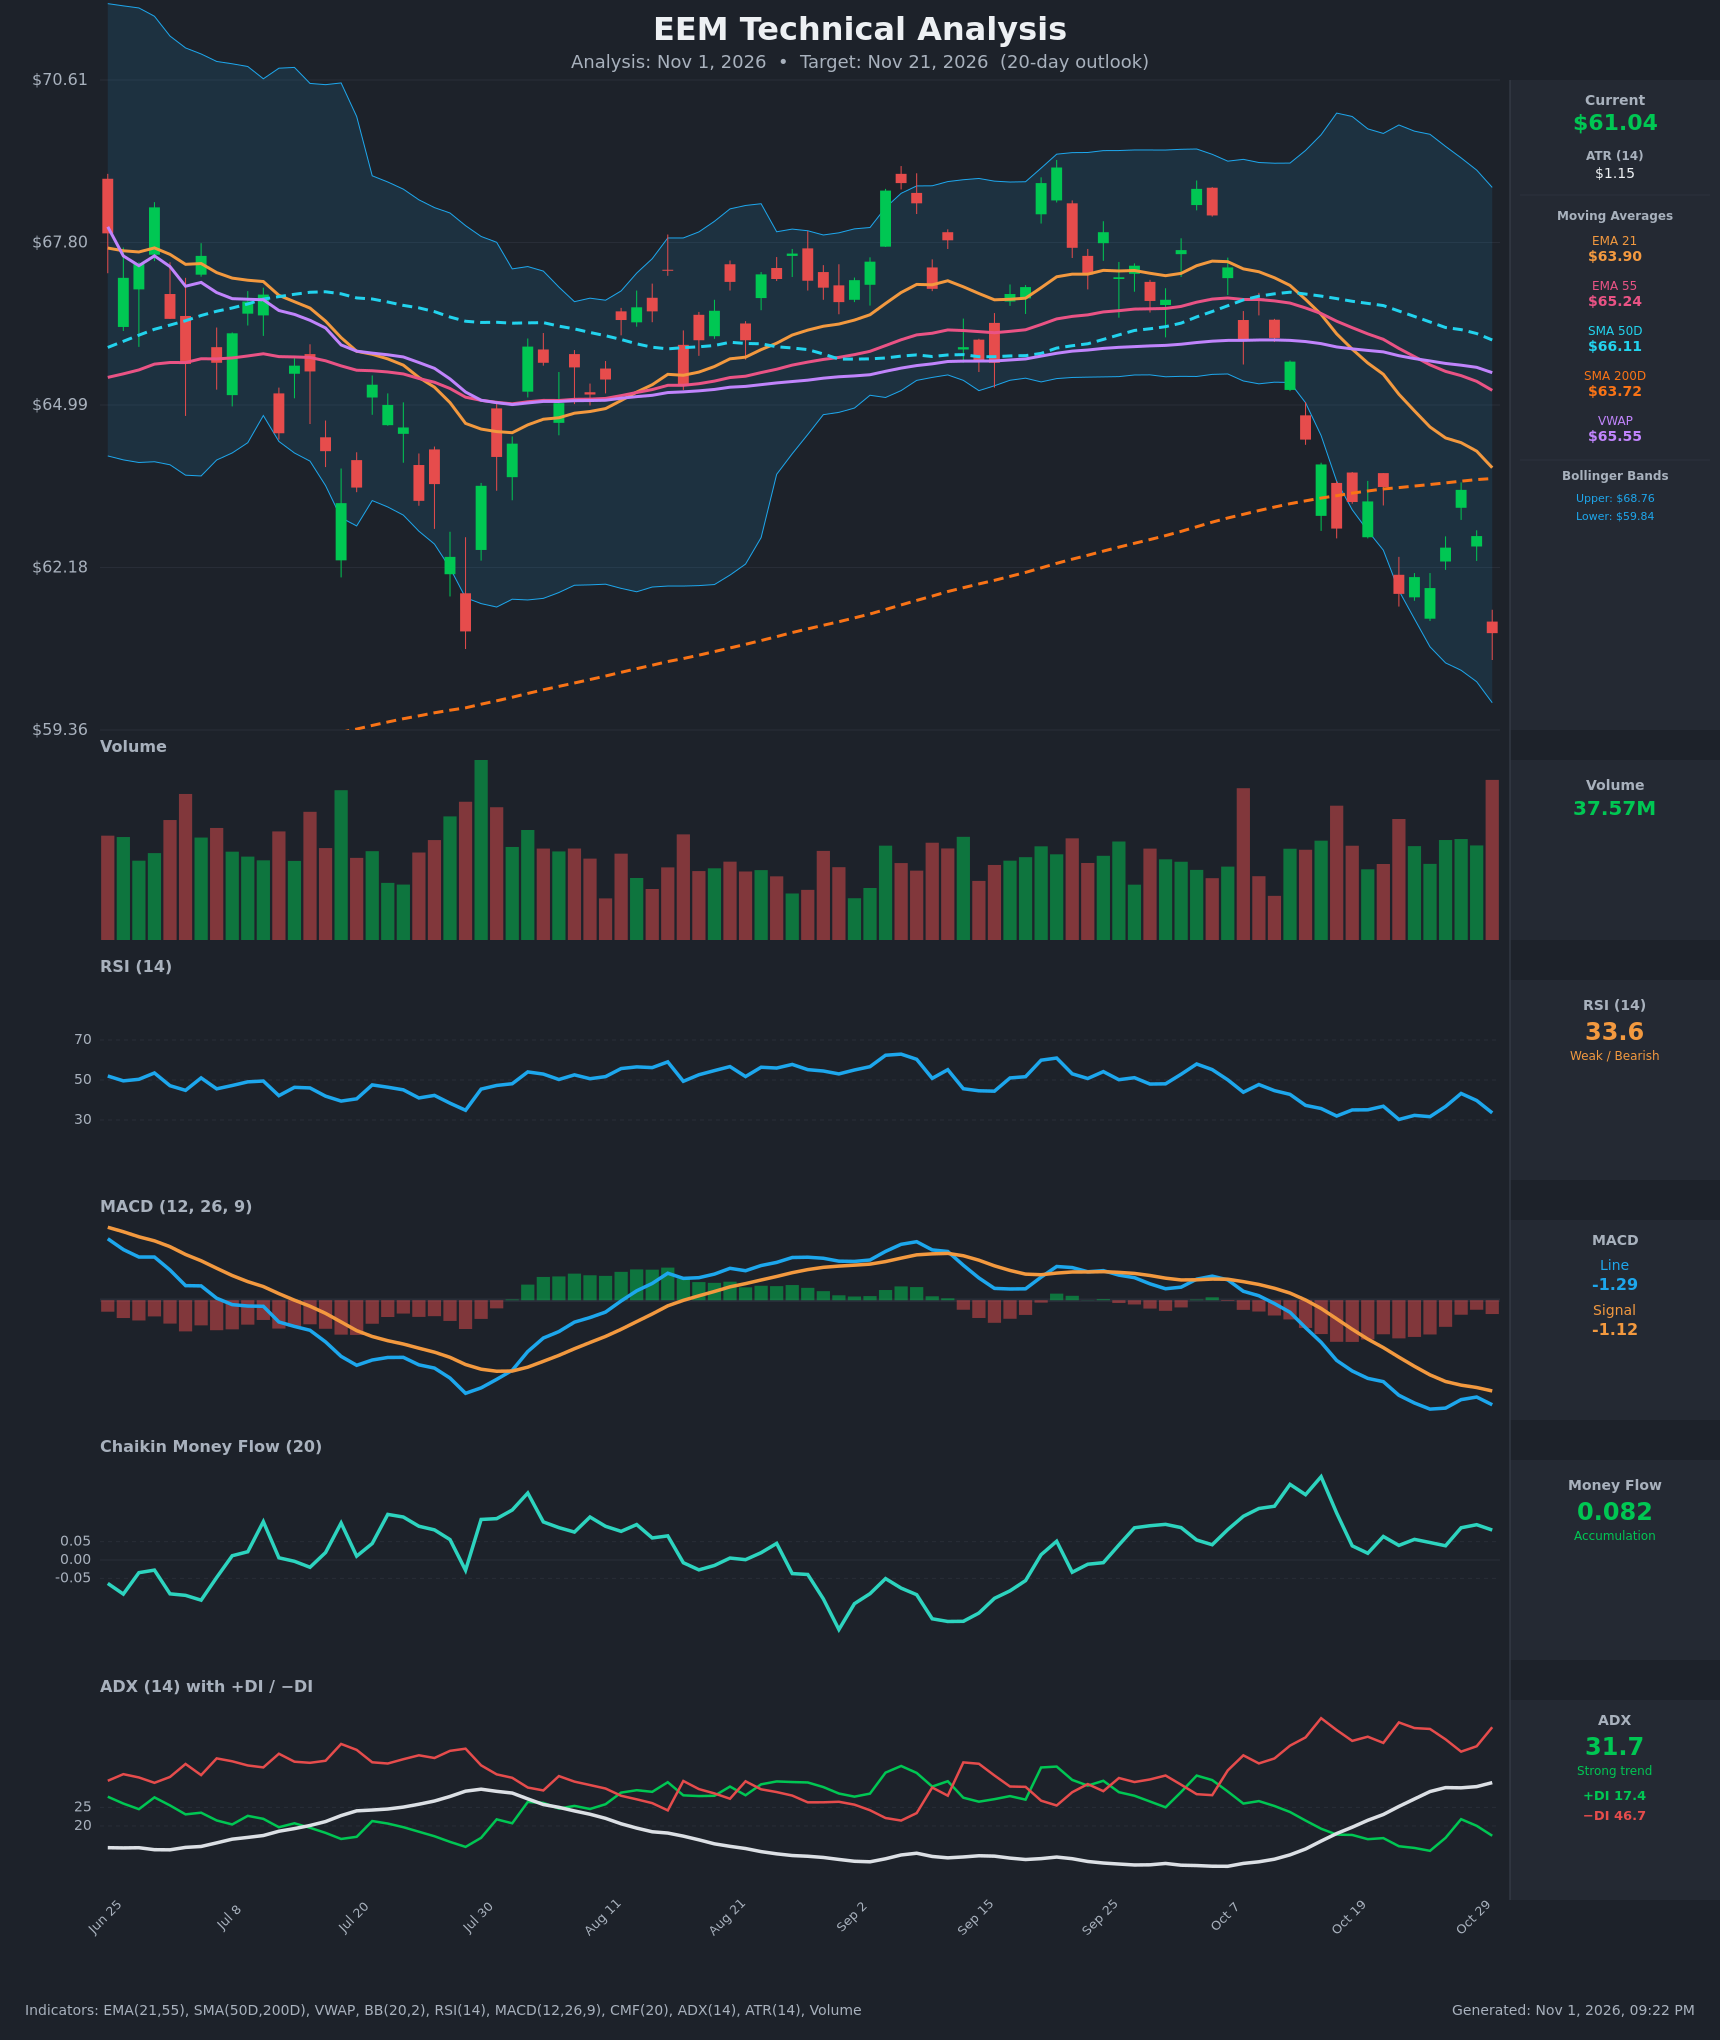
- RSI (14): 33.56, just above oversold (30). It has been stuck in the 30-37 zone for two weeks and rolled over from 43.3 on Oct 28. Momentum is weak but not yet washed out. [Bearish]
- 20 EMA: The EMA 21 is $63.90 and price ($61.04) is about 4.5% below it. The EMA 21 is falling steeply and sits below the EMA 55 ($65.24), so a bearish cross is already in place. It is overhead resistance. [Bearish]
- MACD: The line (-1.286) is below the signal (-1.116), and both are below zero. The line crossed below the signal on Oct 14. The Oct 27-29 bounce briefly narrowed the gap, but the histogram is expanding negative again. [Bearish]
- Bollinger Bands (20): Price is $61.04 against a lower band of $59.84, an upper band of $68.76 and a midline near $64.30. The bands have expanded sharply, and price is walking the lower half after a breakdown. It is about $1.20 (roughly 1 ATR) above the lower band, so a bounce is possible, but there is no squeeze or reversal signal. [Bearish]
- CMF (20): 0.082, above +0.05 and positive through the whole decline. Money flow is still accumulating despite falling prices. This is the one clear contrary signal, and it hints at dip-buying or a possible bounce. [Accumulation]
- ADX (14): 31.7 and rising, up from 11 on Oct 12, so a strong trend is established. −DI (46.7) is far above +DI (17.4), so the bears are firmly in control. [Strong Trend – Bearish]
- Volume: 37.57M, the largest bar on the chart, on a red candle that closed at a new low. Heavy volume on a breakdown through the SMA200 ($63.72) confirms selling pressure. It could also mark short-term capitulation. [Bearish – breakdown confirmation]
DIVERGENCES & TRENDS
- Positive CMF divergence: CMF has stayed above 0.04 throughout the sell-off while price made lower lows. This points to dip-buying, but it has not yet produced a price response.
- RSI: There is no bullish divergence. RSI printed 30.3 on Oct 22 and 33.6 now, against price lows of $61.72 and $61.04. Momentum is only marginally better at lower prices. It has twice failed to climb above 43.
- MACD: It is making new lows, with the line at -1.29 versus -1.34 on Oct 26. This is a trend-confirming reading with no divergence.
- Moving averages: The EMA 21 crossed below the EMA 55 (around Oct 15). The SMA50D ($66.11) is still above the SMA200D ($63.72), so there is no death cross yet, but the gap is narrowing quickly. Price is now below the SMA200D, which is a long-term bearish break. VWAP is $65.55, well above price.
- DI/ADX: −DI has been above +DI since early October, and ADX is rising through 25 and 30. This is a textbook strong downtrend.
CHART PATTERNS
- Bearish Flag / Pennant (continuation): The sharp drop from about $65.5 to $61.7 was followed by a weak bounce to about $63.5 (Oct 27-28). That bounce stalled just under the SMA200 and EMA 21. Resuming the downtrend would be consistent with the flag in the reference diagram. The measured move (pole of about $3.8 from the $63.5 breakdown level) points to roughly $59.7, which also coincides with the lower Bollinger Band.
- Bearish Triple Top / Double Top (reversal, background): Repeated failures near $68-68.5 (late Aug, late Sep, early Oct) followed by a break of the $64.5-65 base support the shift into a downtrend.
- The measured moves from these patterns are mostly fulfilled, so the extension is likely to be modest rather than a collapse.
POTENTIAL SCENARIOS
- Scenario 1: Bearish Flag Continuation — Sellers keep control, with the SMA200 and EMA 21 acting as resistance. Price grinds to the lower Bollinger Band and slightly beyond. Trigger: a daily close below $60.50 on sustained volume, with MACD histogram expanding. Target: $59.50-$59.80, with an extension to about $58.50. Invalidation: a daily close above $63.75 (SMA200). (50% probability)
- Scenario 2: Bullish Oversold Bounce — RSI near 30, price at the lower band and positive CMF produce a relief rally. It fades into the declining EMA 21. Trigger: a close above $62.50 with RSI climbing back above 40. Target: $63.50-$64.00 (SMA200/EMA 21 zone). Invalidation: a failure back below $61.00. (35% probability)
- Scenario 3: Neutral Range Chop — Price oscillates between about $59.80 and $63 as the trend exhausts. Trigger: ADX flattening and RSI holding 35-45. Target: about $61.00. Invalidation: a close outside $59.50-$63.50. (15% probability)
PRICE TARGETS
- Target Price: $59.60 (20-day, Nov 21, 2026)
- Expected Range: $56.60 to $63.30 (width $6.70, about 11% of current price, in line with the 14-21 day guidance)
- Key Levels: Support at $59.84 (lower Bollinger Band), Resistance at $63.72 (SMA200D, with EMA 21 at $63.90 just above)
OVERALL BIAS
OVERALL BIAS: BEARISH - Price is below the EMA 21/55 and the SMA200 after a heavy-volume breakdown. ADX is 31.7 with −DI at 46.7 versus +DI at 17.4, and MACD is negative and widening. The positive CMF and near-oversold RSI argue for a bounce risk, so conviction is moderate and the downside is probably limited to the $59-60 area.
This is educational analysis and not financial advice.