GLD 20-day bearish forecast — Nov 1, 2026
- Bias: Bearish
- Timeframe: 20 days (made Nov 1, 2026, target date Nov 20, 2026)
- Price at analysis: $355.78
- Price target: $349.00
- Expected range: $332.00 – $372.00
- Result: Pending — graded after the close on Nov 20, 2026
Get a free AI analysis of GLD today
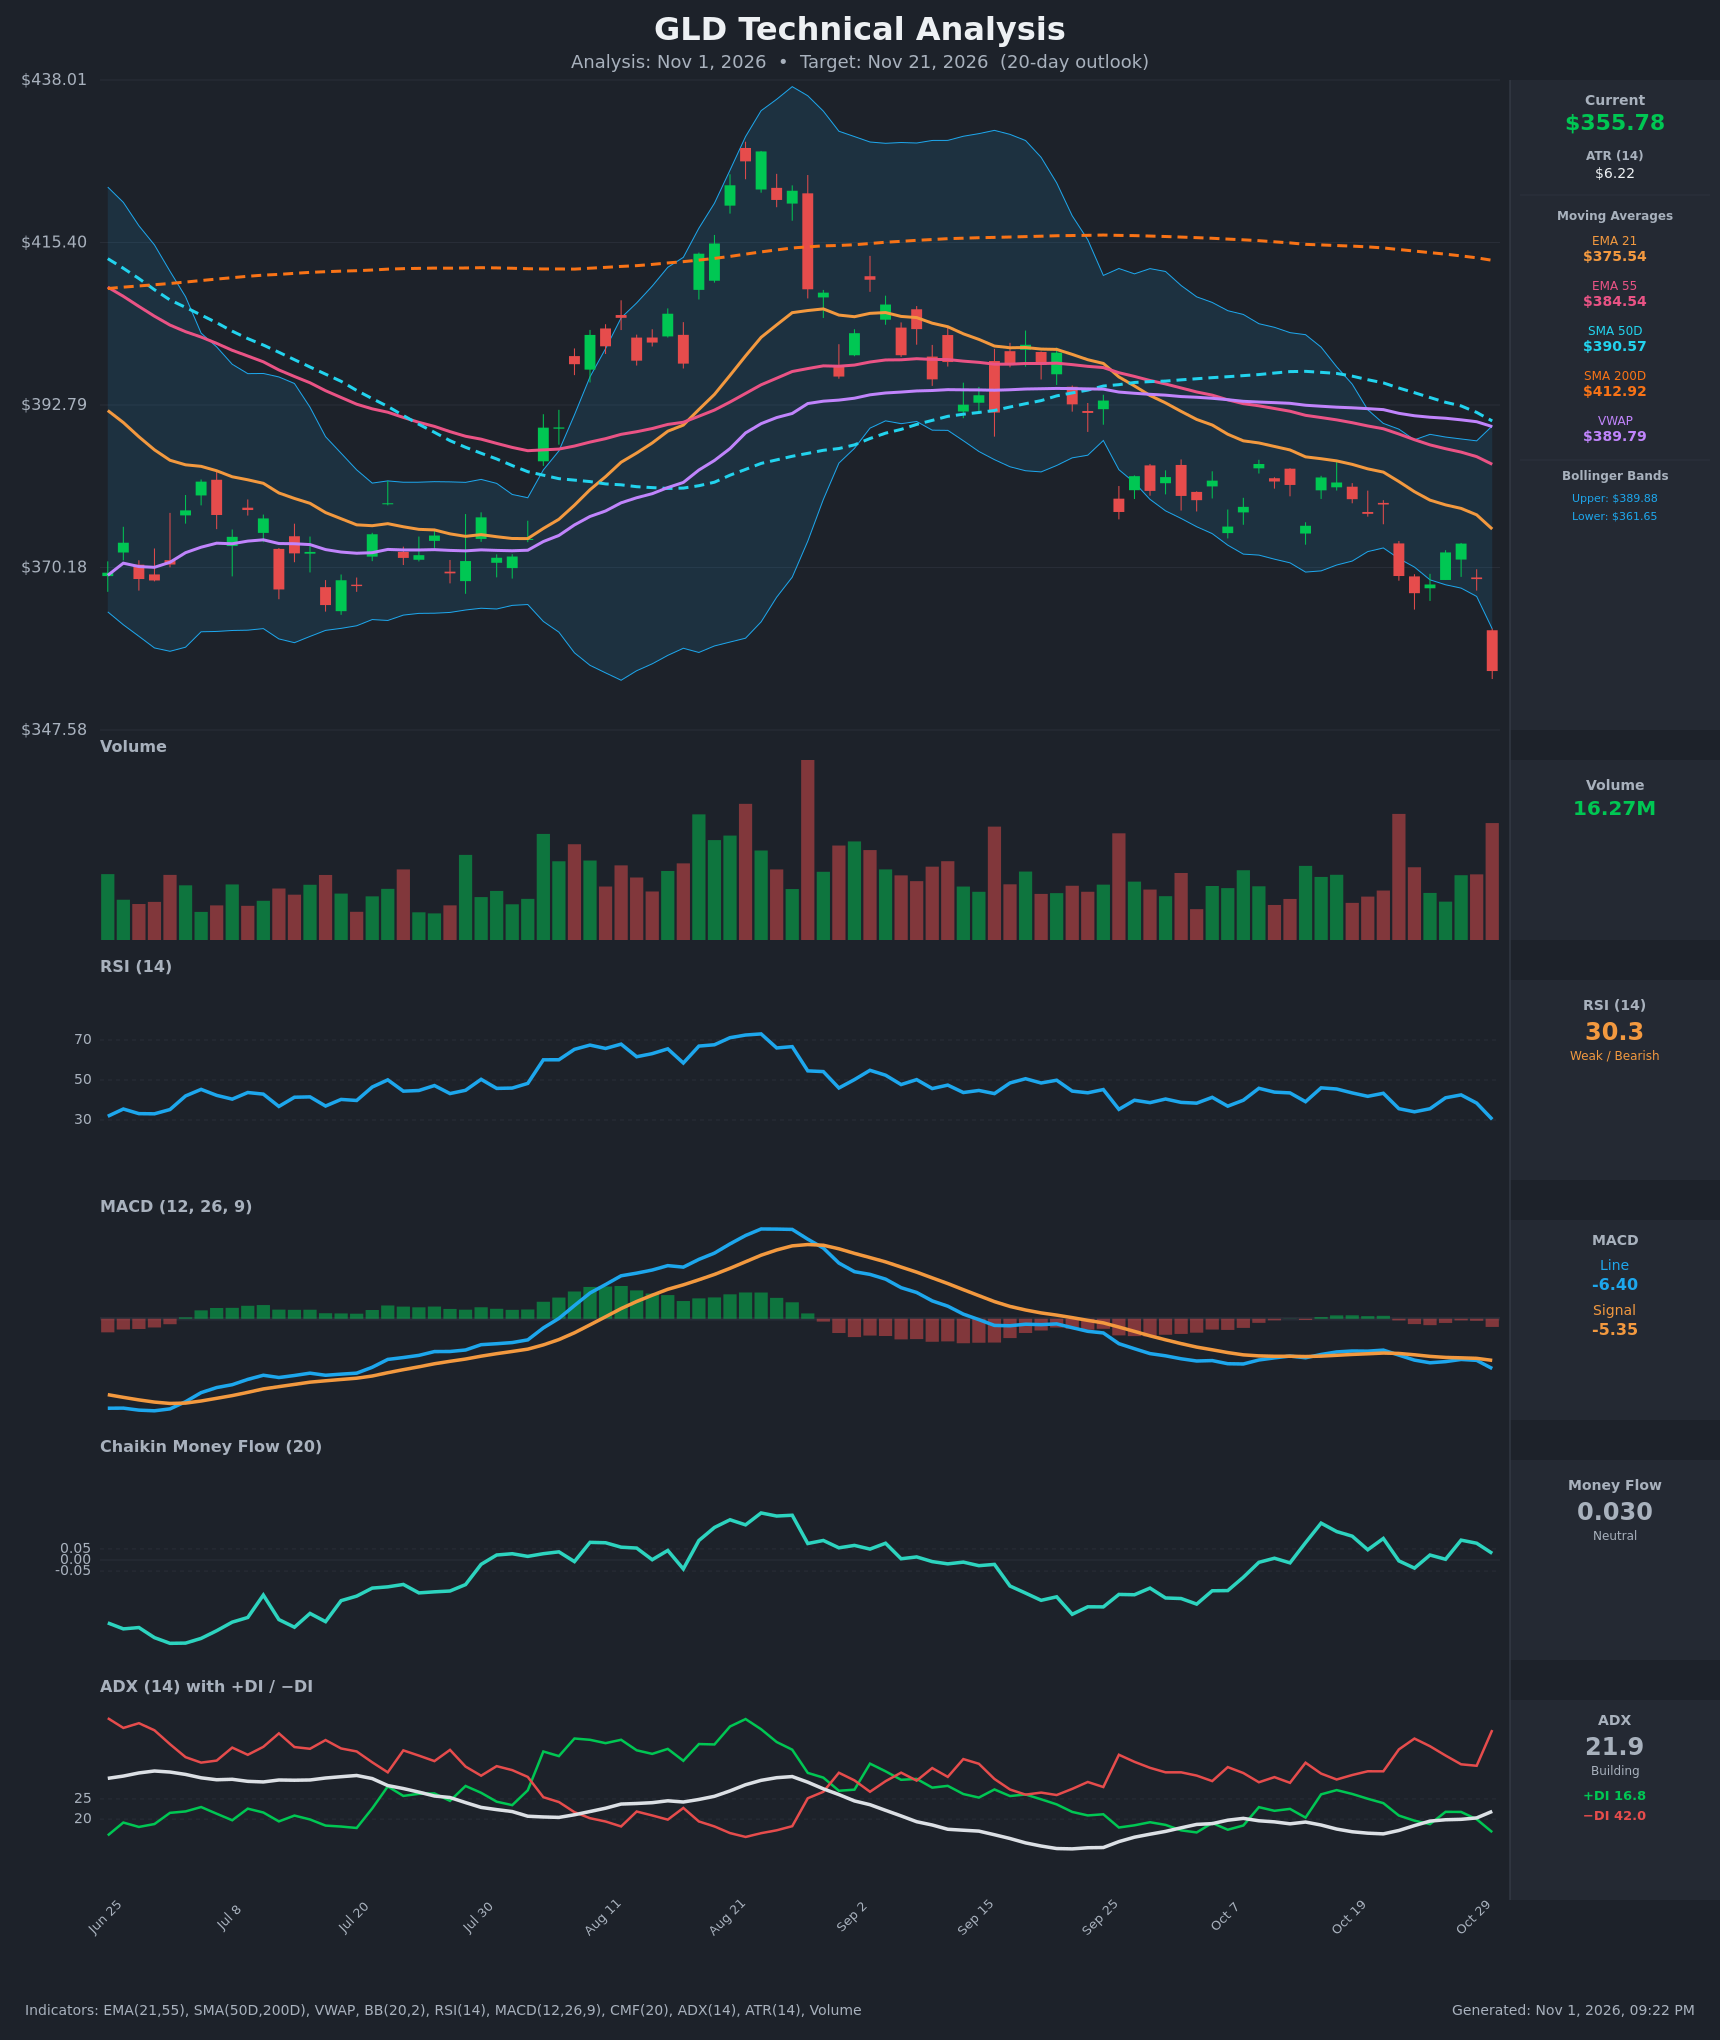
Analysis
TECHNICAL INDICATORS
- RSI (14): 30.32, right at the oversold threshold and down sharply from 38.5 the day before and 42.6 two days earlier. It has made a lower low versus the Oct 23 reading of 34.1. Momentum is clearly negative, though stretched, so a relief bounce is possible. [Bearish]
- 20 EMA (EMA 21): $375.54, with price at $355.78, about 5.3% below it. The EMA is falling every bar (387.0 → 375.5 over 15 bars) and acts as overhead resistance. EMA21 is also below EMA55 ($384.54), a standing bearish stack. [Bearish]
- MACD: Line -6.395 is below Signal -5.347, and the gap is widening (about -1.05 histogram) after a brief flattening in mid-October. Both lines are below zero, and the bearish crossover is renewing. [Bearish]
- Bollinger Bands (20): Upper $389.88, lower $361.65, midline about $375.76. Price at $355.78 closed about $5.9 below the lower band, a band-walk and breakdown candle. This signals strong downside momentum, but it is also statistically stretched and favors a snap-back toward the lower band or midline at some point. [Bearish]
- CMF (20): 0.030, between -0.05 and +0.05, and it has hovered slightly positive for weeks. Despite the price drop, there is no clear distribution signature, which tempers the bearish case and hints at possible capitulation or dip-buying. [Neutral]
- ADX (14): 21.9 and rising (from 16.4 on Oct 21), with -DI at 42.0 far above +DI at 16.8. The trend is still "building" and only just above the weak-trend zone, but the directional spread is lopsided, so the bears are firmly in control. [Weak-to-Building Trend, Bearish direction]
- Volume: 16.27M on the latest large red candle, one of the heavier bars in the recent series. Heavy volume on a breakdown confirms selling pressure. It could also mark an exhaustion/capitulation bar if the next sessions fail to follow through lower. [Bearish confirmation, possible exhaustion]
DIVERGENCES & TRENDS
- Moving averages: Price is below EMA21 ($375.54), EMA55 ($384.54), SMA50D ($390.57), SMA200D ($412.92) and VWAP ($389.79). The SMA50D is already below the SMA200D (death-cross regime), so the long-term trend is down.
- No bullish divergence yet: RSI made a lower low (34.1 → 30.3) alongside price making a lower low (366.61 → 355.78), so the two are confirming rather than diverging.
- MACD: It re-crossed bearishly around Oct 22 and has been widening. After a brief convergence it is now accelerating down.
- DI lines: -DI has stayed above +DI throughout the table, and the gap widened from 13 to 25 points in the last 8 bars.
- ADX: It is turning up from the lows, which suggests a new down-leg is gaining strength rather than fading.
- CMF: It is the one non-confirming indicator, holding near zero or positive while price falls. That is a mild positive divergence and the main reason a bounce is a real risk.
CHART PATTERNS
- Bearish rectangle / range breakdown: Price consolidated between roughly $366 and $385 from late September to late October. The latest bar broke decisively below the $366.6 floor. The measured move (range height ~$19 projected from $366) points to about $347.
- Post-peak topping structure: The August spike to ~$430 followed by a rollover resembles a rounded/double-top reversal. The breakdown through the 200-day and 50-day averages confirms the reversal, in line with the "Bearish Double Top" and "Bearish Head and Shoulders" family from the reference diagram.
- Descending staircase: Lower highs and lower lows through September and October resemble a bearish flag or descending-triangle continuation, which also targets the high $340s.
- Caveat: The latest bar is an extended, oversold, below-band candle, so retests of the broken $366-369 zone are common before continuation.
POTENTIAL SCENARIOS
- Scenario 1: Bearish Measured-Move Continuation — Price breaks below the Oct 23 low and continues the downtrend, with -DI dominance and a widening MACD gap. Rallies fail at the broken $366-369 support zone or the lower band near $361.65. Trigger: a daily close below ~$353 or a failed bounce under $362. Target: $347-$349, with an extension to $340. Invalidation: a daily close above $375.5 (EMA21). (50% probability)
- Scenario 2: Bullish Oversold Relief Bounce — RSI at 30, price well outside the lower band and a heavy-volume capitulation-style bar trigger mean reversion back toward the Bollinger midline and EMA21 area. Trigger: a reclaim of $362 and then $368 with a bullish RSI turn. Target: $370-$376. Invalidation: a close back below $352. (35% probability)
- Scenario 3: Neutral Choppy Base — Price stabilizes after the sharp drop, with CMF flat and ADX weak, trading in a $350-$366 band. Trigger: several inside-range closes, with no break of $350 or $366. Target: $355-$362. Invalidation: a close outside $348-$368. (15% probability)
PRICE TARGETS
- Target Price: $349.00 (20-day, Nov 21, 2026)
- Expected Range: $332.00 to $372.00 (width $40, about 11.2% of current price, consistent with the 14-21 day guidance of 8-12%)
- Key Levels: Support at $347.50 (measured-move zone and recent chart low), Resistance at $361.65 (lower Bollinger Band), with secondary resistance at $368.00 (Oct 22-23 breakdown zone) and $375.54 (EMA21)
OVERALL BIAS
OVERALL BIAS: BEARISH - Price is below every moving average with a death-cross regime, -DI (42.0) dominating +DI (16.8), a widening bearish MACD, and a heavy-volume break below the $366 range floor that projects to about $347. RSI at 30 and the close below the lower band raise the odds of a bounce, so conviction is moderate.
This is educational analysis and not financial advice.