IREN 20-day bearish forecast — Nov 1, 2026
- Bias: Bearish
- Timeframe: 20 days (made Nov 1, 2026, target date Nov 20, 2026)
- Price at analysis: $23.95
- Price target: $22.30
- Expected range: $21.00 – $24.00
- Result: Pending — graded after the close on Nov 20, 2026
Get a free AI analysis of IREN today
Analysis
TECHNICAL INDICATORS
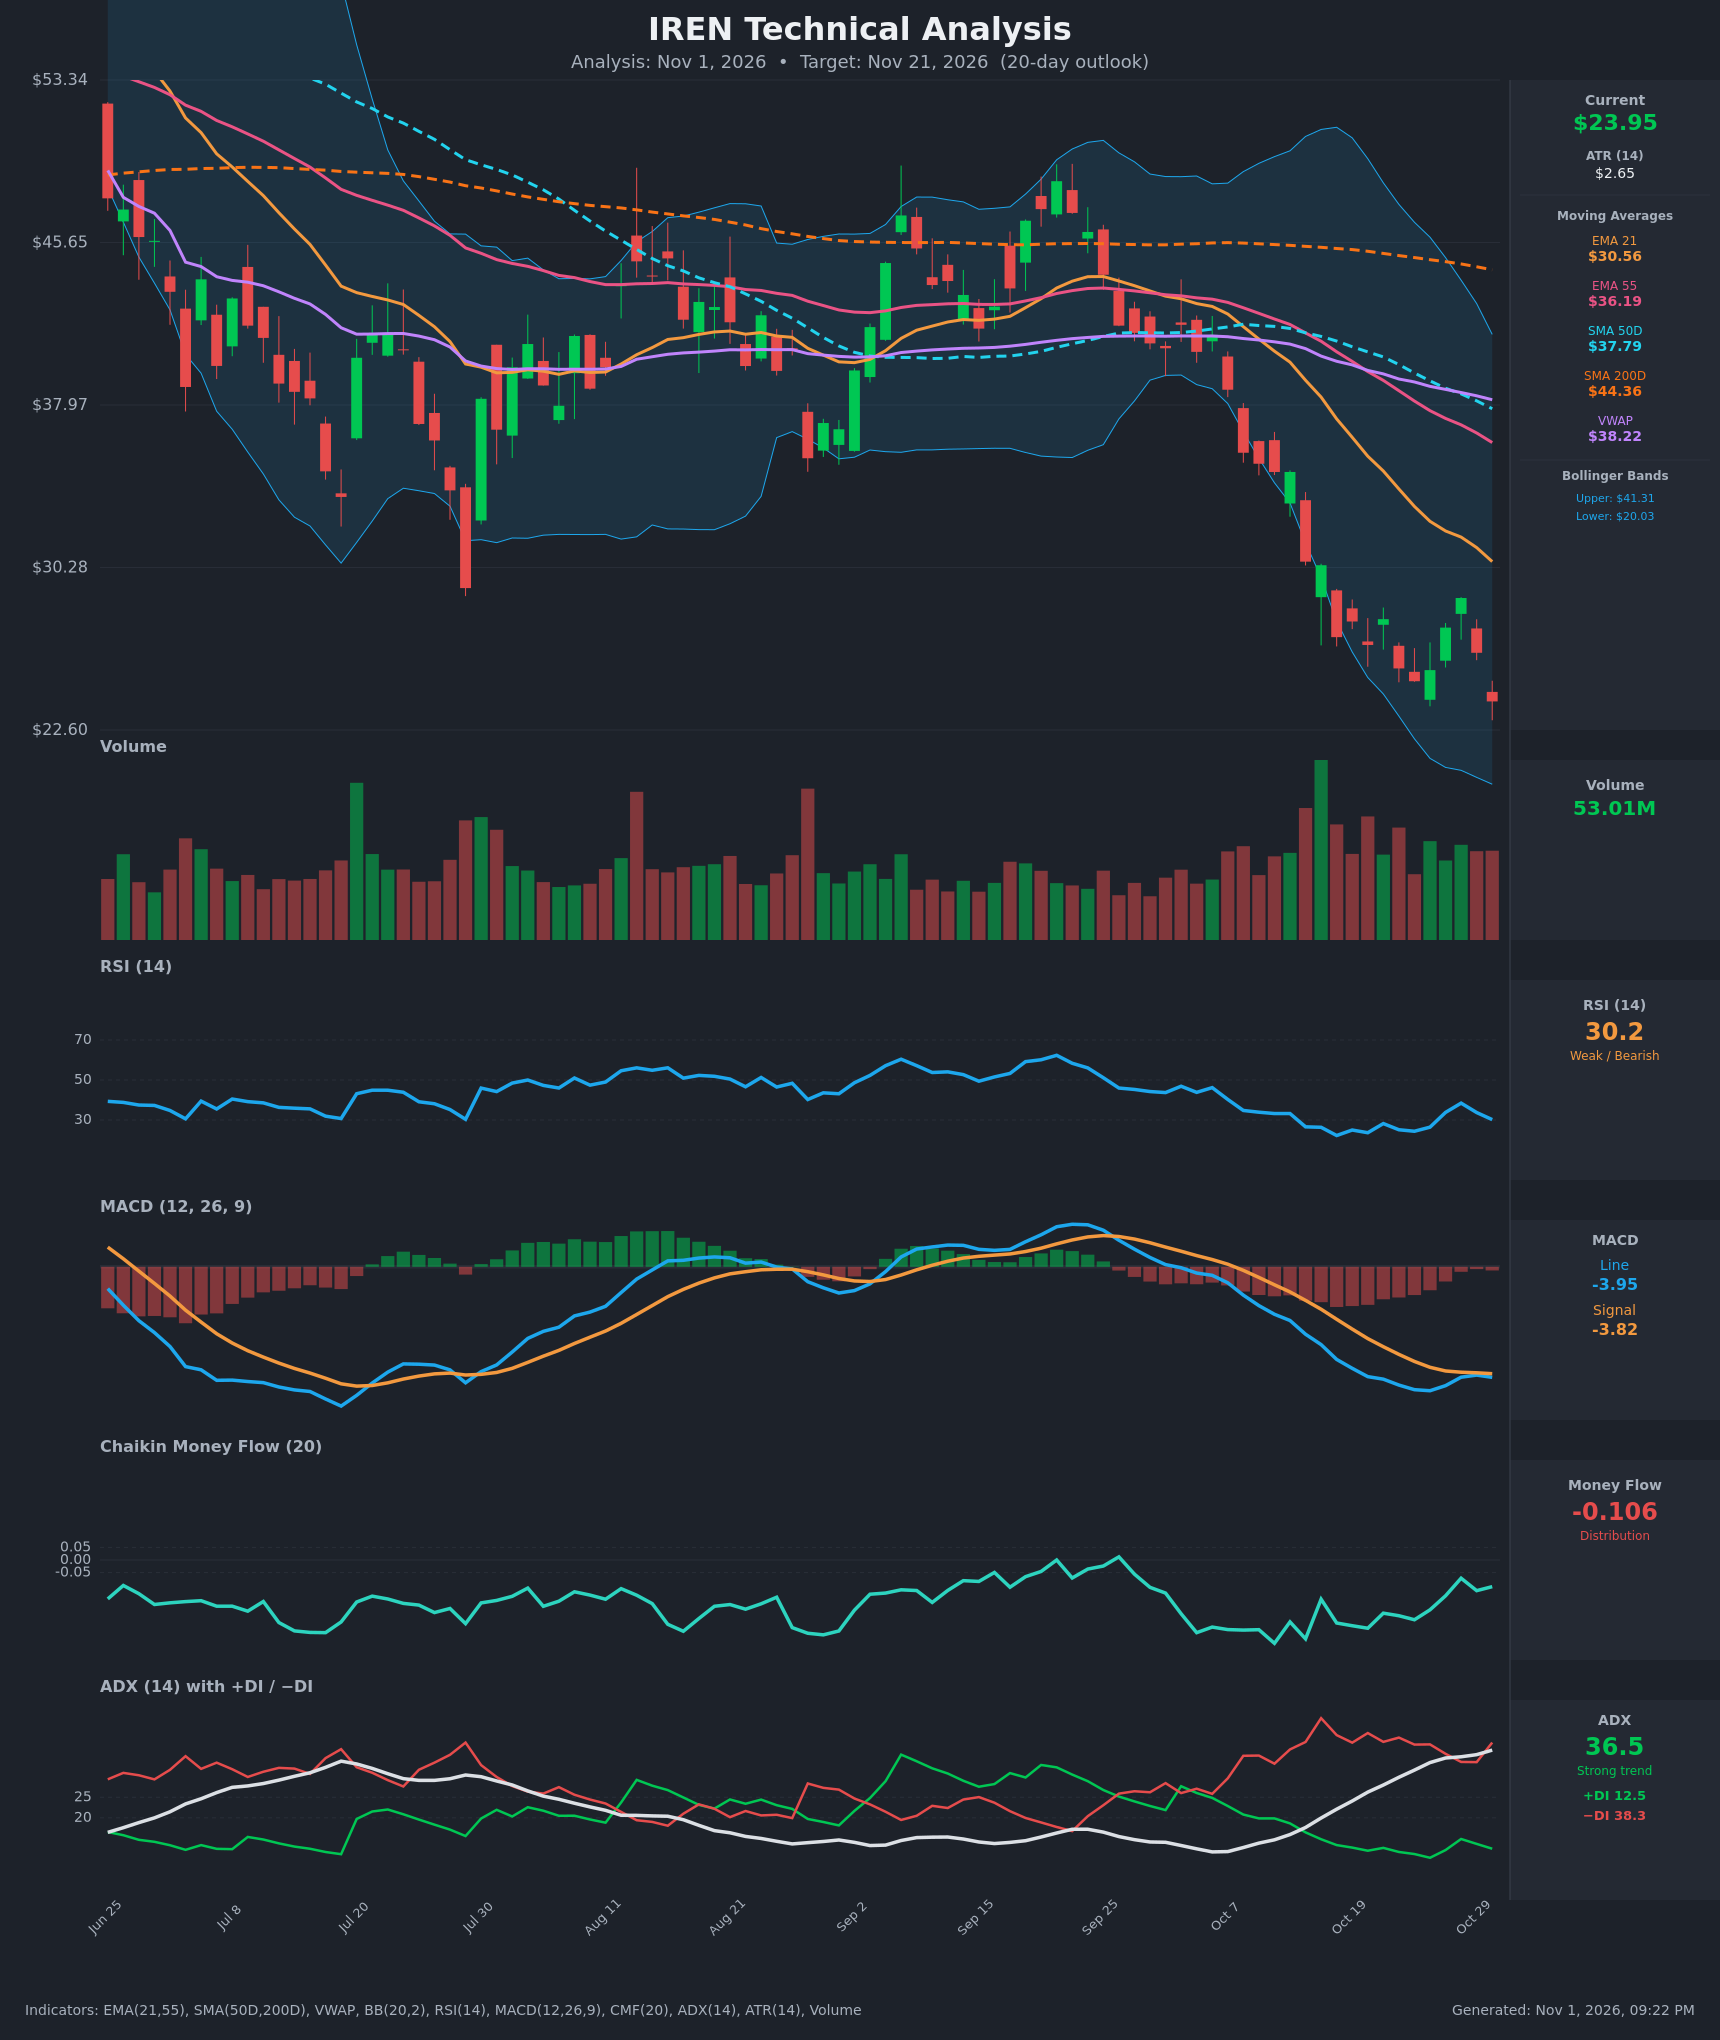
- RSI (14): 30.20, right at the oversold threshold. It bounced from 22.2 (Oct 16) to 38.4 (Oct 28) and has now rolled over again (38.4 → 33.7 → 30.2). Momentum is weak and falling, though not yet at an extreme. [Bearish]
- 20 EMA (EMA 21 = $30.56): Price at $23.95 is about 22% below it. The EMA is falling steeply (from $40.51 on Oct 12) and acts as heavy overhead resistance. EMA21 is also below EMA55 ($36.19). [Bearish]
- MACD: Line -3.95 is below Signal -3.82, with a small negative histogram (about -0.13). The line had been recovering toward the signal on Oct 27-29, but it has turned back down and stays below the signal. Both lines are deeply negative. [Bearish]
- Bollinger Bands (20): Upper $41.31, lower $20.03. The bands are wide, which shows expanded volatility. Price is in the lower quarter of the band and has been walking down it, about $3.9 above the lower band. The recent candles hug the lower half, which is typical of a persistent downtrend rather than a reversal. [Bearish]
- CMF (20): -0.106, below the -0.05 threshold and negative for the whole 15-bar table (range -0.07 to -0.33). That points to persistent distribution, although the reading has improved from the -0.33 low. [Distribution]
- ADX (14): 36.5 and rising steadily (from 14.7 on Oct 12), so this is a strong, strengthening trend. −DI (38.3) sits far above +DI (12.5), so sellers are firmly in control. [Strong Trend – Bearish]
- Volume: 53.01M on the latest red candle, which is steady, elevated activity. The high-volume red bars in mid-October (the breakdown) and the lack of volume-driven reversal candles show sellers are still active. There is no capitulation spike yet. [Bearish – selling pressure continuing]
DIVERGENCES & TRENDS
- Mild bullish RSI divergence: Price made a lower low ($23.95 vs $24.91 on Oct 23), while RSI is higher (30.2 vs 24.4). This hints at slowing downside momentum but is not confirmed by any price reversal.
- Moving-average structure is fully bearish: SMA50D ($37.79) is already below SMA200D ($44.36), so a death cross is in place. Price is below VWAP ($38.22), SMA50, SMA200, and both EMAs. The order is Price < EMA21 < EMA55 < SMA50 < SMA200.
- ADX/DI: −DI has been above +DI throughout, and ADX has risen from 14.7 to 36.5. That is a classic strengthening downtrend.
- MACD: The line is below the signal with no bullish crossover. The brief attempt to converge (Oct 27-29) failed.
- Price action: Lower highs and lower lows since mid-September. The Oct 28 bounce to $28.84 failed below $30, and the price has since lost the Oct 23 low.
CHART PATTERNS
- The chart shows a sharp breakdown from a consolidation range of about $38-$45 (Aug-Oct). Since then the price has moved in a downward channel, with small-bodied rebounds that resemble a Bearish Flag / Pennant in the continuation family. The flag formed between about $25 and $29, and the latest candle breaks below its lower boundary.
- The flag-pole measured move runs from the break near $37 to the ~$27 flag area, roughly $10. Projecting that from the flag would imply sub-$20, but the lower Bollinger Band at $20.03 is the likelier first stopping area within 20 days.
- No bullish reversal pattern, such as a double bottom or falling wedge, has been confirmed. The RSI divergence is only an early warning.
POTENTIAL SCENARIOS
- Scenario 1: Bearish Flag Breakdown Continuation — The trend is strong (ADX 36.5, −DI dominant), CMF shows distribution, and all moving averages are overhead and falling. Price keeps stair-stepping lower toward the lower Bollinger Band. Trigger: daily close below the recent low of $23.95, or a failed bounce below $26. Target: $20.00–$22.00, with an extension possible toward $18 on a capitulation flush. Invalidation: daily close above $28.84 (the Oct 28 high). (55% probability)
- Scenario 2: Bullish Oversold Relief Bounce — RSI near 30 with mild divergence and price near the lower band could trigger a mean-reversion bounce. Trigger: a strong green candle on rising volume, with RSI back above 40 and CMF turning above -0.05. Target: $27.00–$29.00 (prior flag highs, with EMA21 at $30.56 as the ceiling). Invalidation: loss of the $20.00 area. (33% probability)
- Scenario 3: Neutral Basing Range — Price chops sideways as selling exhausts but buyers stay absent. Trigger: ATR contraction and ADX rolling over from the high. Target: $22.00–$26.00 range. Invalidation: close outside $20.00–$28.00. (12% probability)
PRICE TARGETS
- Target Price: $22.30 (20-day horizon)
- Expected Range: $21.00 to $24.00 (width $3.00, about 12.5% of the current price)
- Key Levels: Support at $20.03 (lower Bollinger Band), Resistance at $26.25 (recent swing close and flag resistance; EMA21 at $30.56 is the larger ceiling)
OVERALL BIAS
OVERALL BIAS: BEARISH - ADX of 36.5 with −DI (38.3) far above +DI (12.5), a bearish MACD, distribution in CMF, and price below every moving average (including a death cross) all favor continued downside. Oversold RSI and the mild divergence argue for volatile bounces, but they do not yet reverse the trend.
This is educational analysis and not financial advice.