MSTR 20-day bearish forecast — Nov 1, 2026
- Bias: Bearish
- Timeframe: 20 days (made Nov 1, 2026, target date Nov 20, 2026)
- Price at analysis: $130.51
- Price target: $124.00
- Expected range: $111.00 – $141.00
- Result: Pending — graded after the close on Nov 20, 2026
Get a free AI analysis of MSTR today
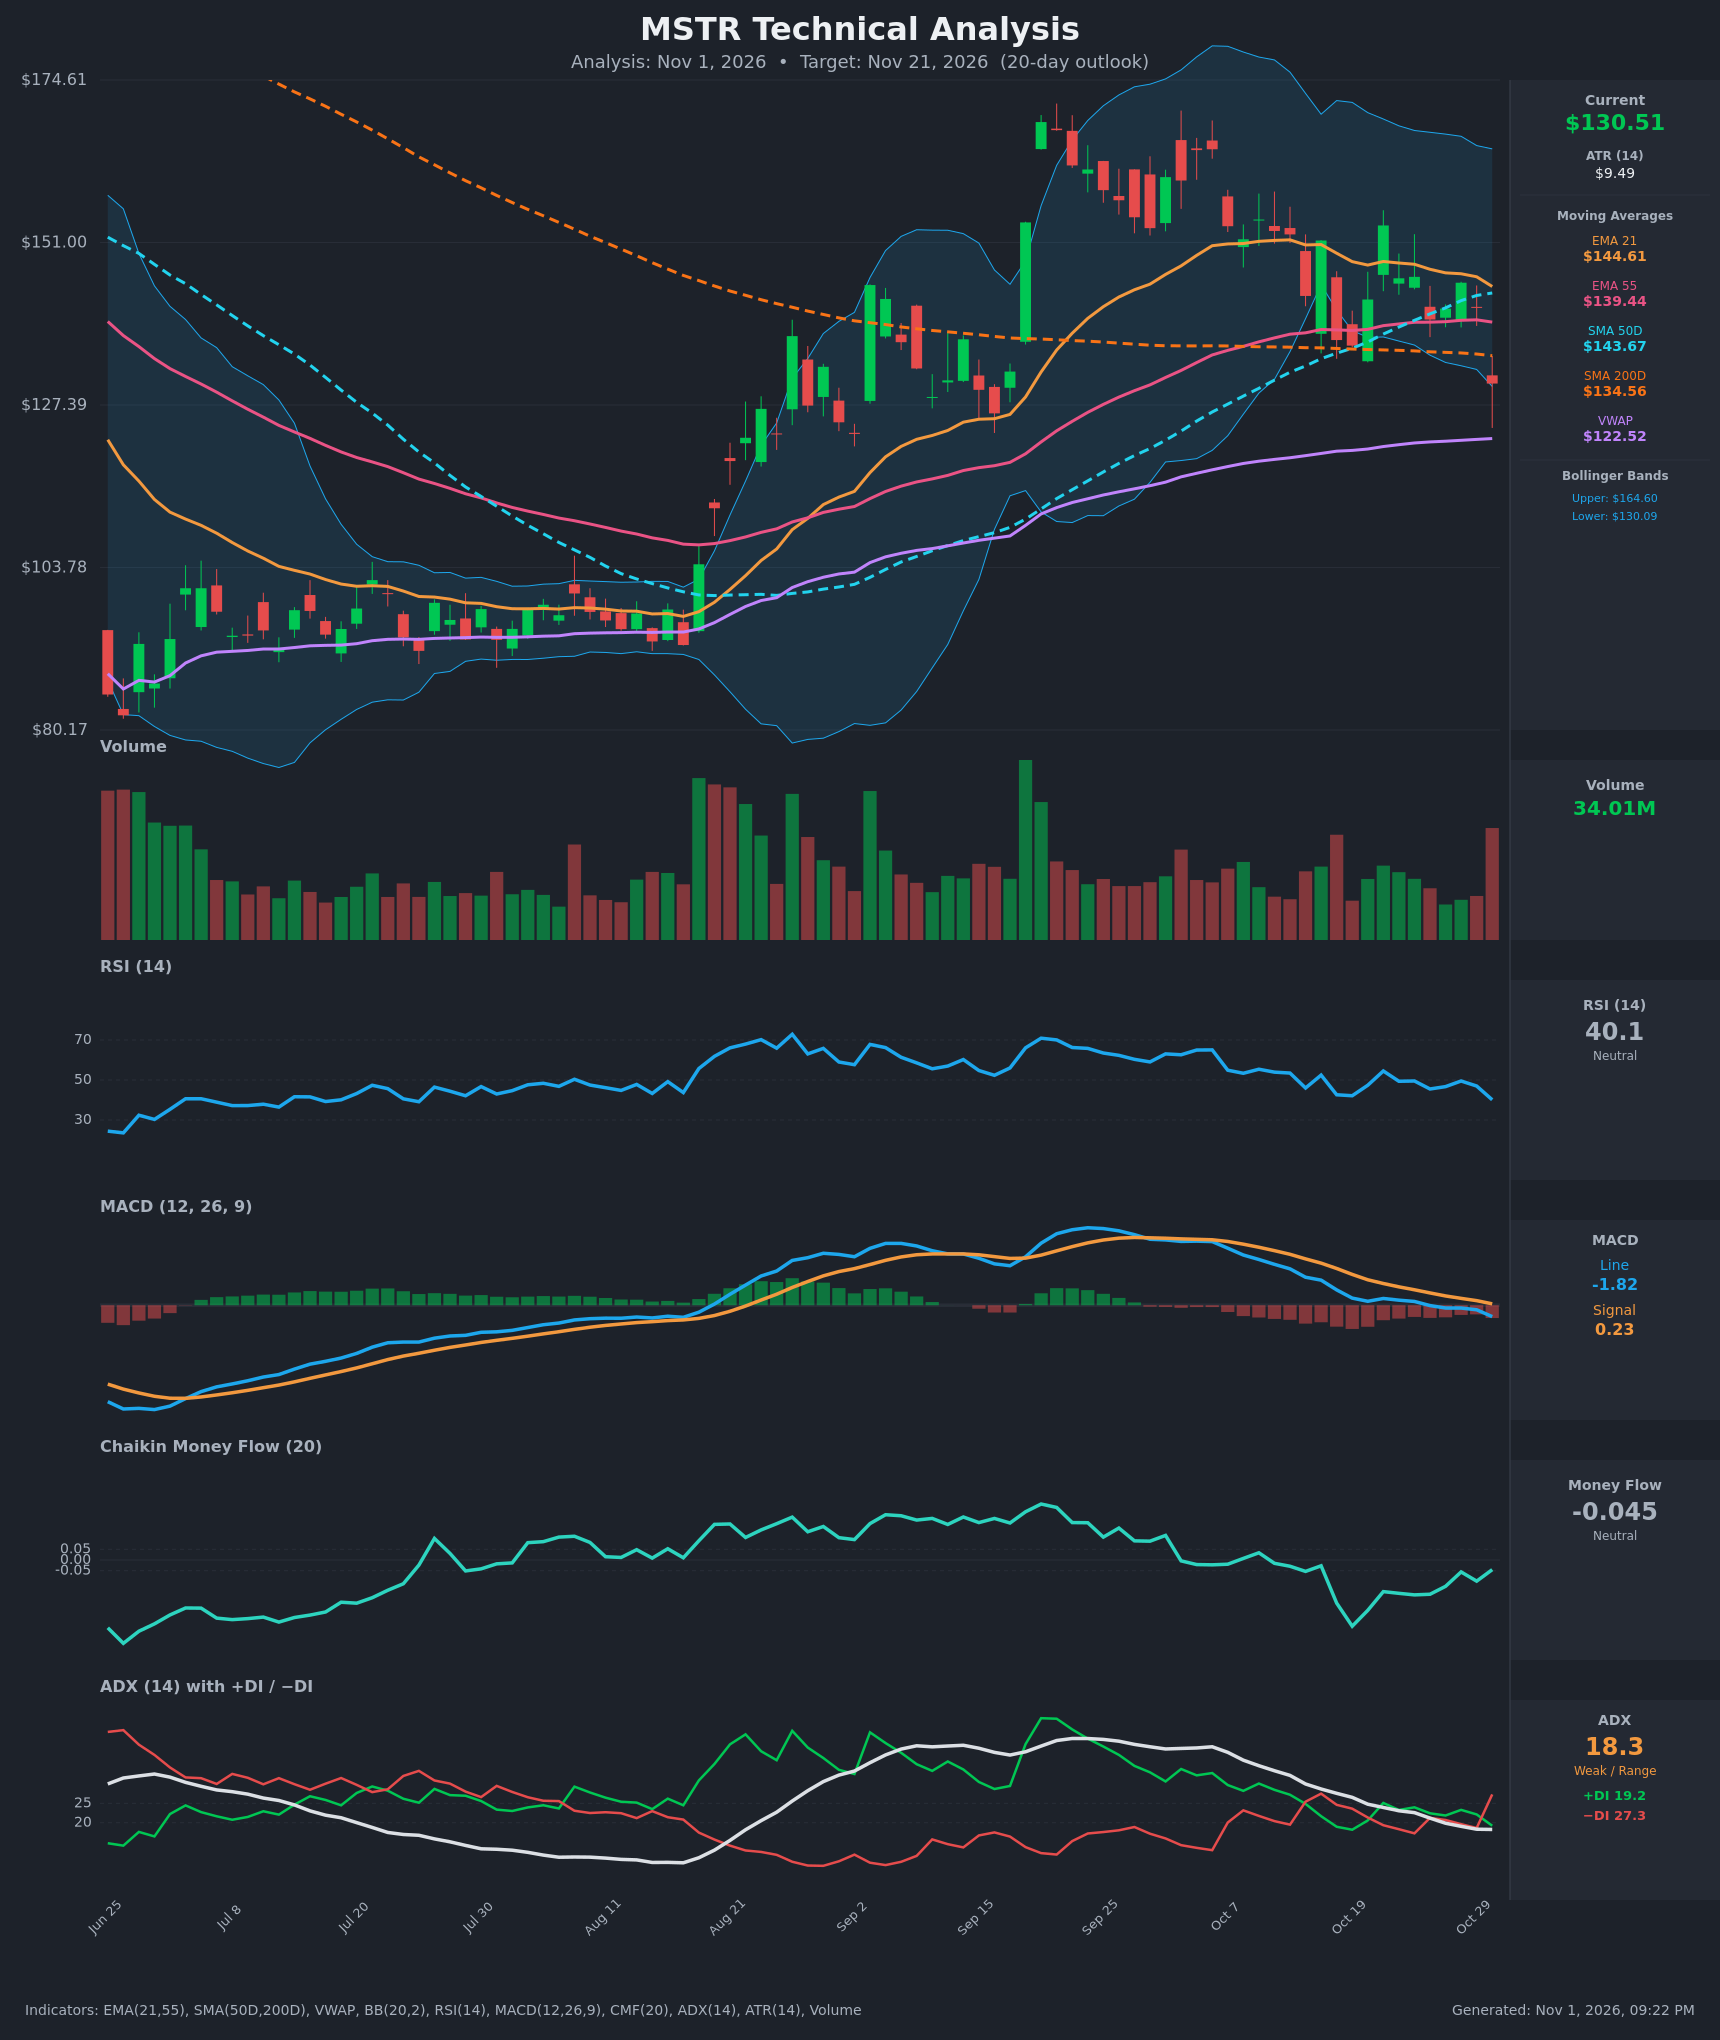
Analysis
TECHNICAL INDICATORS
- RSI (14): 40.11, down from about 49.5 on Oct 28 and sliding toward the 30 oversold line. It has made lower highs since the Sept peak (70) and sits below 50. Momentum is fading but not yet oversold. [Bearish]
- 20 EMA: The 21 EMA is $144.61 and falling. Price at $130.51 is about 9.7% below it, so the EMA acts as overhead resistance. Price is also below the SMA50D ($143.67) and EMA55 ($139.44). [Bearish]
- MACD: The line is -1.82 and the signal is +0.23, so the line is below the signal and negative. A bearish crossover occurred around Oct 26. The histogram is negative and widening (about -2.05), and the line is accelerating down. [Bearish]
- Bollinger Bands (20): Upper $164.61, lower $130.09. Price at $130.51 is right at the lower band after a -7.8% daily drop, and the bands have started to narrow. A walk down the band is possible, but a snap-back toward the 20-period mid-band (~$147) is also possible on a mean-reversion bounce. [Neutral]
- CMF (20): -0.045, inside the neutral zone (-0.05 to +0.05). It has deteriorated from positive in Aug–Sept to mostly negative in October (low of -0.31 on Oct 19) and is hovering near the distribution threshold. [Neutral]
- ADX (14): 18.3 and falling, which indicates a weak trend or range. −DI (27.3) jumped above +DI (19.2) on the latest bar, a fresh bearish DI crossover. The trend is weak, but the directional edge now favors sellers. [Weak Trend, bearish lean]
- Volume: 34.01M, the highest bar in the recent stretch, on a large red candle that broke the Oct support area. High volume on a breakdown suggests real selling pressure, though it could also mark a capitulation spike. [Bearish, possible capitulation]
DIVERGENCES & TRENDS
- No clear bullish divergence yet. RSI (40) and price are both making lower lows together.
- Bearish trend: the MACD line went from +6.56 (Oct 12) to -1.82, and the bearish crossover is confirmed. RSI is making lower highs, and the 21 EMA has rolled over from its $151 peak.
- ADX peaked at 33 on Oct 12 and has faded to 18, showing the August–September uptrend has exhausted. The new −DI > +DI crossover on the last bar hints at a new directional leg down.
- MA structure is mixed. The SMA50D ($143.67) is above the SMA200D ($134.56), a golden-cross-type structure. Price has now fallen below both, and the EMA21 is rolling toward the EMA55 (a bearish cross is approaching). Price at $130.51 is under the SMA200D, which turns the long-term level into resistance.
- Price sits well above VWAP ($122.52), which is the next major support area.
CHART PATTERNS
- Bearish Head and Shoulders / Double Top (loose): The late-Sept spike (~$170) followed by a lower high around Oct 7–21 (~$153) and the breakdown through the ~$135–137 area resembles a rolling top. The neckline in the $135–137 region has broken on heavy volume. The measured move (head about $170 minus neckline $136 = ~$34) would point toward ~$100, which seems aggressive for 20 days. The VWAP at $122.5 and the Aug breakout base of $115–128 are more realistic stops along the way.
- Bearish Rising Wedge/Flag: The Oct 12–29 consolidation between ~$136 and ~$153 behaved like a bearish range or flag, and the downside break fits a continuation of the decline from the peak.
- The Bollinger lower-band tag with a volume spike creates a risk of an oversold bounce, so a short-term bounce toward $136–140 is plausible before the next leg.
POTENTIAL SCENARIOS
- Scenario 1: Bearish Breakdown Continuation — Price loses the lower Bollinger Band and SMA200D, with −DI dominating and MACD histogram expanding, and drifts toward VWAP and the Aug breakout zone. Trigger: daily close below $128 (the last wick low area). Target: $119–122 (VWAP $122.5 and gap/base area). Invalidation: daily close above $139.5 (EMA55). (50% probability)
- Scenario 2: Neutral/Bullish Relief Bounce then Fade — The capitulation-volume bar and lower-band tag produce a mean-reversion bounce toward the EMA55/SMA200D cluster ($134–140), which then fails under the EMA21/SMA50D ($144). Trigger: close above $134.6 (SMA200D). Target: $138–144. Invalidation: close below $127. (32% probability)
- Scenario 3: Bearish Extension to Measured Move — Heavy distribution turns CMF below -0.05 and ADX rises above 25 with −DI leading, pushing toward $105–112. Trigger: break below VWAP $122.5. Target: $108. Invalidation: reclaim of $131 on a closing basis. (18% probability)
PRICE TARGETS
Timeframe: 20 days (ATR $9.49, so ~$42 of 1-sigma-ish movement over 20 days at typical scaling, tempered by the lower-band support).
- Target Price: $124.00 (just above the VWAP, consistent with a bearish bias and the partial bounce risk)
- Expected Range: $111.00 to $141.00 (width $30 = ~23% of current price, which fits the 14–30 day band scaling for a volatile stock)
- Key Levels: Support at $122.52 (VWAP), Resistance at $134.56 (SMA200D)
Self-check: Range width = $141.00 - $111.00 = $30.00. $30.00 / $130.51 = 23.0%. This is wider than a 14-day range would be, and the target ($124) is below the current price of $130.51, consistent with a bearish bias.
OVERALL BIAS
OVERALL BIAS: BEARISH - A fresh bearish MACD crossover with a widening negative histogram, a −DI > +DI crossover, price below the 21 EMA, EMA55, SMA50D and SMA200D, and a high-volume breakdown all favor further downside toward VWAP (~$122.5). The lower Bollinger Band tag and weak ADX leave room for a relief bounce, so conviction is moderate.
This is educational analysis and not financial advice.