MARA 20-day bearish forecast — Nov 1, 2026
- Bias: Bearish
- Timeframe: 20 days (made Nov 1, 2026, target date Nov 20, 2026)
- Price at analysis: $6.77
- Price target: $6.40
- Expected range: $6.05 – $6.85
- Result: Pending — graded after the close on Nov 20, 2026
Get a free AI analysis of MARA today
Analysis
TECHNICAL INDICATORS
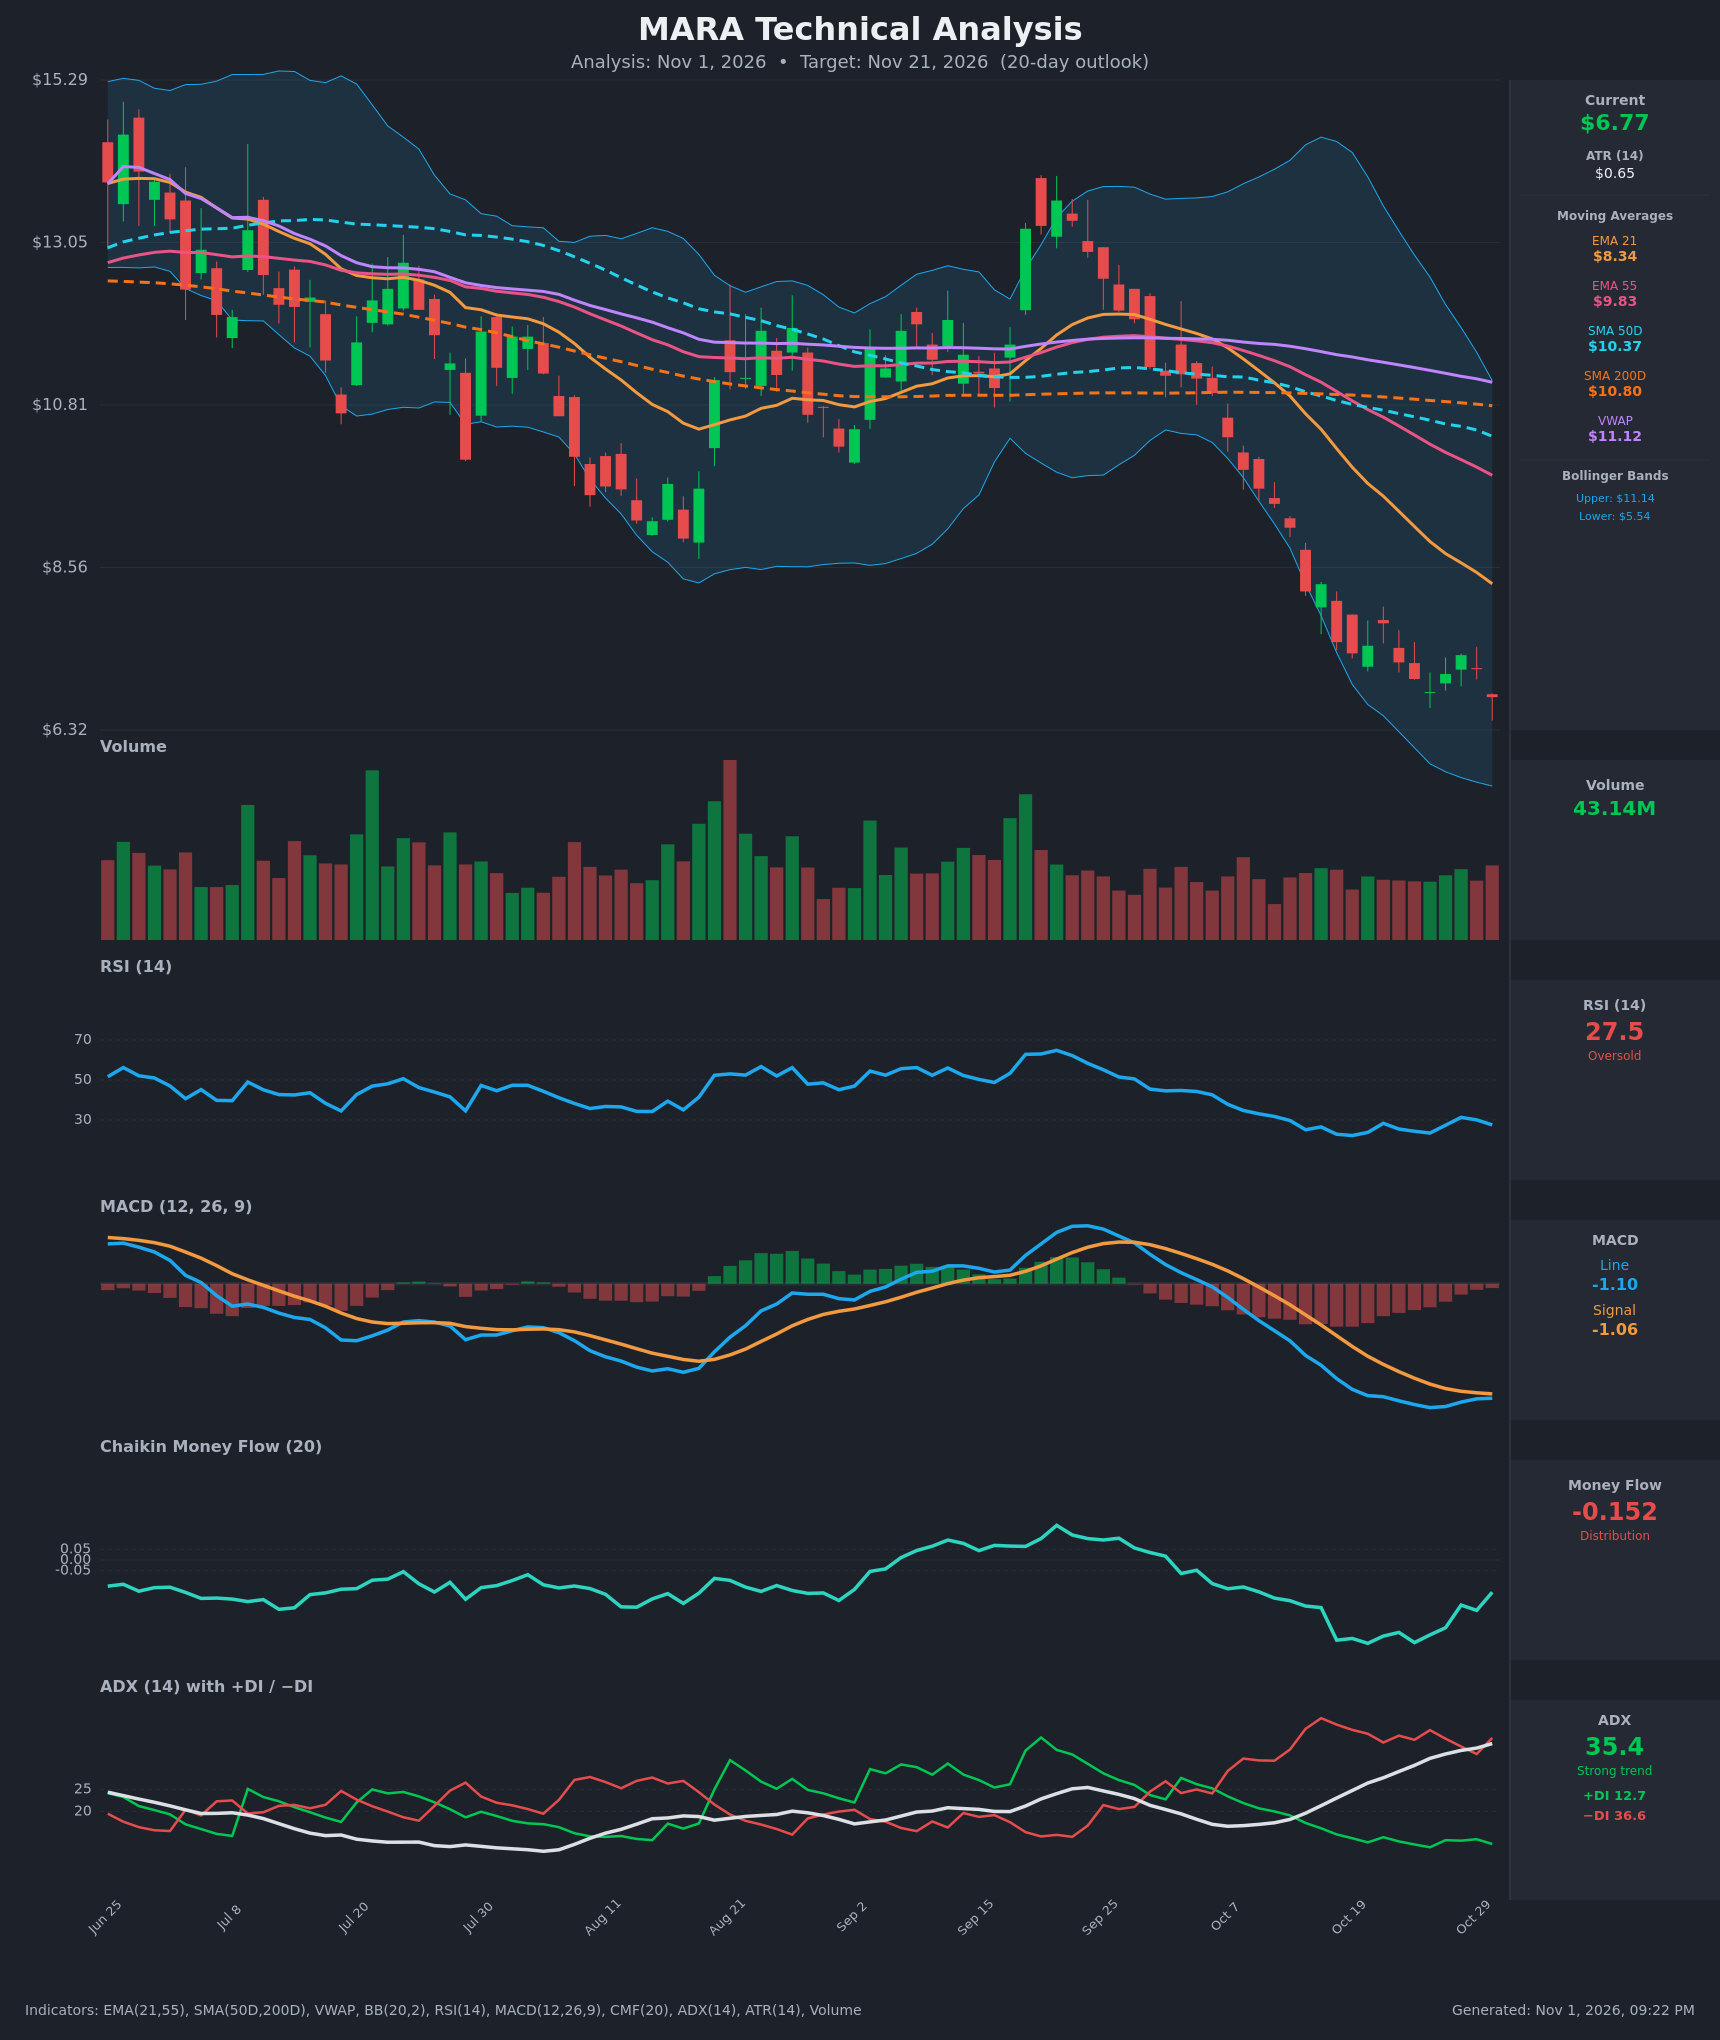
- RSI (14): 27.55, just above the oversold line at 30 and below 30 for most of the last two weeks. It has made higher lows (22.2 on Oct 19, 23.5 on Oct 26, 27.5 now) while price made lower lows, so downside momentum is fading, but it hasn't turned up decisively. [Bearish]
- 20 EMA: The EMA21 is $8.34 and falling, with EMA55 at $9.83. Price at $6.77 is about 19% below the EMA21, and the EMA21 has been below the EMA55 since mid-October. Both act as overhead resistance. [Bearish]
- MACD: Line is -1.0985 and signal is -1.0567, so the line is still below the signal. The histogram is about -0.04 and has shrunk from roughly -0.3 in mid-October. A bullish cross is close, but it would be a weak signal at deeply negative levels. [Bearish]
- Bollinger Bands (20): Upper is $11.14 and lower is $5.54, so the bands are very wide after the sell-off. Price at $6.77 sits in the lower third and has been riding the lower band, with the latest candle printing a new low. That shows persistent selling, though it is stretched. [Bearish]
- CMF (20): -0.152, well below -0.05 and negative throughout the decline. It has improved from the -0.39 trough, which hints that selling pressure is easing. It still shows clear distribution. [Distribution]
- ADX (14): 35.4 and rising for 15 straight bars (from 17.5), with −DI at 36.6 far above +DI at 12.7. This is a strong, established downtrend with bears firmly in control. [Strong Trend – Bearish]
- Volume: 43.14M on the latest bar, in line with the recent average. Selling is steady rather than a climactic spike. Capitulation volume would mark a washout low, and it hasn't appeared yet. [Neutral to Bearish: orderly distribution]
DIVERGENCES & TRENDS
- Bullish RSI divergence (mild): Price made lower lows ($7.38 → $6.84 → $6.77) while RSI made higher lows (22.2 → 23.5 → 27.5). This suggests a relief bounce is possible, but it needs confirmation.
- CMF improving: It has risen from -0.39 to -0.15 while price keeps drifting lower, which is another early sign of selling exhaustion.
- MACD histogram contraction: Bearish momentum is slowing, and a bullish cross could occur within days. Both lines are still deeply negative.
- Death cross in place: SMA50 ($10.37) crossed below SMA200 ($10.80) around Oct 16–19. This is a major bearish trend signal.
- MA stack fully bearish: Price ($6.77) < EMA21 ($8.34) < EMA55 ($9.83) < SMA50 ($10.37) < SMA200 ($10.80) < VWAP ($11.12). Every average slopes down, and price is far below all of them.
- DI and ADX: −DI has stayed above +DI since early October, with ADX rising. The trend is intact and accelerating, not exhausting.
- Failed bounce: The Oct 28 rally to $7.35 stalled and rolled over, with the Oct 30 close (-5.6%) at a new low.
CHART PATTERNS
- Bearish pennant / flag-type continuation (most relevant): After the sharp drop from ~$11 to ~$7.4, price has been consolidating in small-bodied candles between roughly $6.8 and $7.4 (Oct 19–29). The Oct 30 close at $6.77 breaks the bottom of that range, which is the bearish continuation trigger. The measured move from the flagpole points well below $6, toward the lower Bollinger Band ($5.54).
- Descending channel: Lower highs and lower lows since the Sep 18–19 peak near $13–14. This remains the dominant structure.
- Bullish falling wedge (low probability): The pattern isn't clearly formed. The RSI divergence is the only supporting evidence, and a reversal would need a close back above ~$7.40.
POTENTIAL SCENARIOS
- Scenario 1: Bearish Trend Continuation — The strong downtrend (ADX 35, −DI 36.6 vs +DI 12.7) continues. Price breaks the Oct 19–29 consolidation low, with the death cross and an overhead MA stack acting as resistance, and drifts toward the lower Bollinger Band. Trigger: Daily close below $6.50 with volume at or above 40M. Target: $6.00–$6.40, with an extension to $5.54 (lower BB). Invalidation: Daily close above $7.40. (50% probability)
- Scenario 2: Bullish Oversold Relief Bounce — RSI divergence, improving CMF and a MACD histogram near a cross trigger a short-covering rally. Price retraces toward the EMA21 area but stays under resistance. Trigger: Close above $7.35–$7.40 with a bullish MACD cross. Target: $7.80–$8.30 (EMA21 near $8.3). Invalidation: Close back below $6.50. (35% probability)
- Scenario 3: Neutral Base-Building — Price chops in a tight $6.40–$7.20 range as sellers tire and ADX rolls over. Trigger: Several sessions of narrowing ranges and declining volume. Target: $6.60–$6.90. Invalidation: Close outside $6.30–$7.40. (15% probability)
PRICE TARGETS
Timeframe: 20 days (Nov 21, 2026). Sizing check: the range width is $0.80, which is 11.8% of the current price and in line with the 14–21 day guidance of 8–12%.
- Target Price: $6.40
- Expected Range: $6.05 to $6.85
- Key Levels: Support at $6.30, Resistance at $7.35
OVERALL BIAS
OVERALL BIAS: BEARISH - ADX at 35.4 with −DI far above +DI, a death cross, price below every moving average, persistent CMF distribution, and a fresh breakdown below the recent consolidation point to further downside. The RSI divergence and oversold reading argue for volatile bounces, but not yet a confirmed reversal.
This is educational analysis and not financial advice.