NIO 20-day bearish forecast — Nov 1, 2026
- Bias: Bearish
- Timeframe: 20 days (made Nov 1, 2026, target date Nov 20, 2026)
- Price at analysis: $3.21
- Price target: $3.08
- Expected range: $2.95 – $3.30
- Result: Pending — graded after the close on Nov 20, 2026
Get a free AI analysis of NIO today
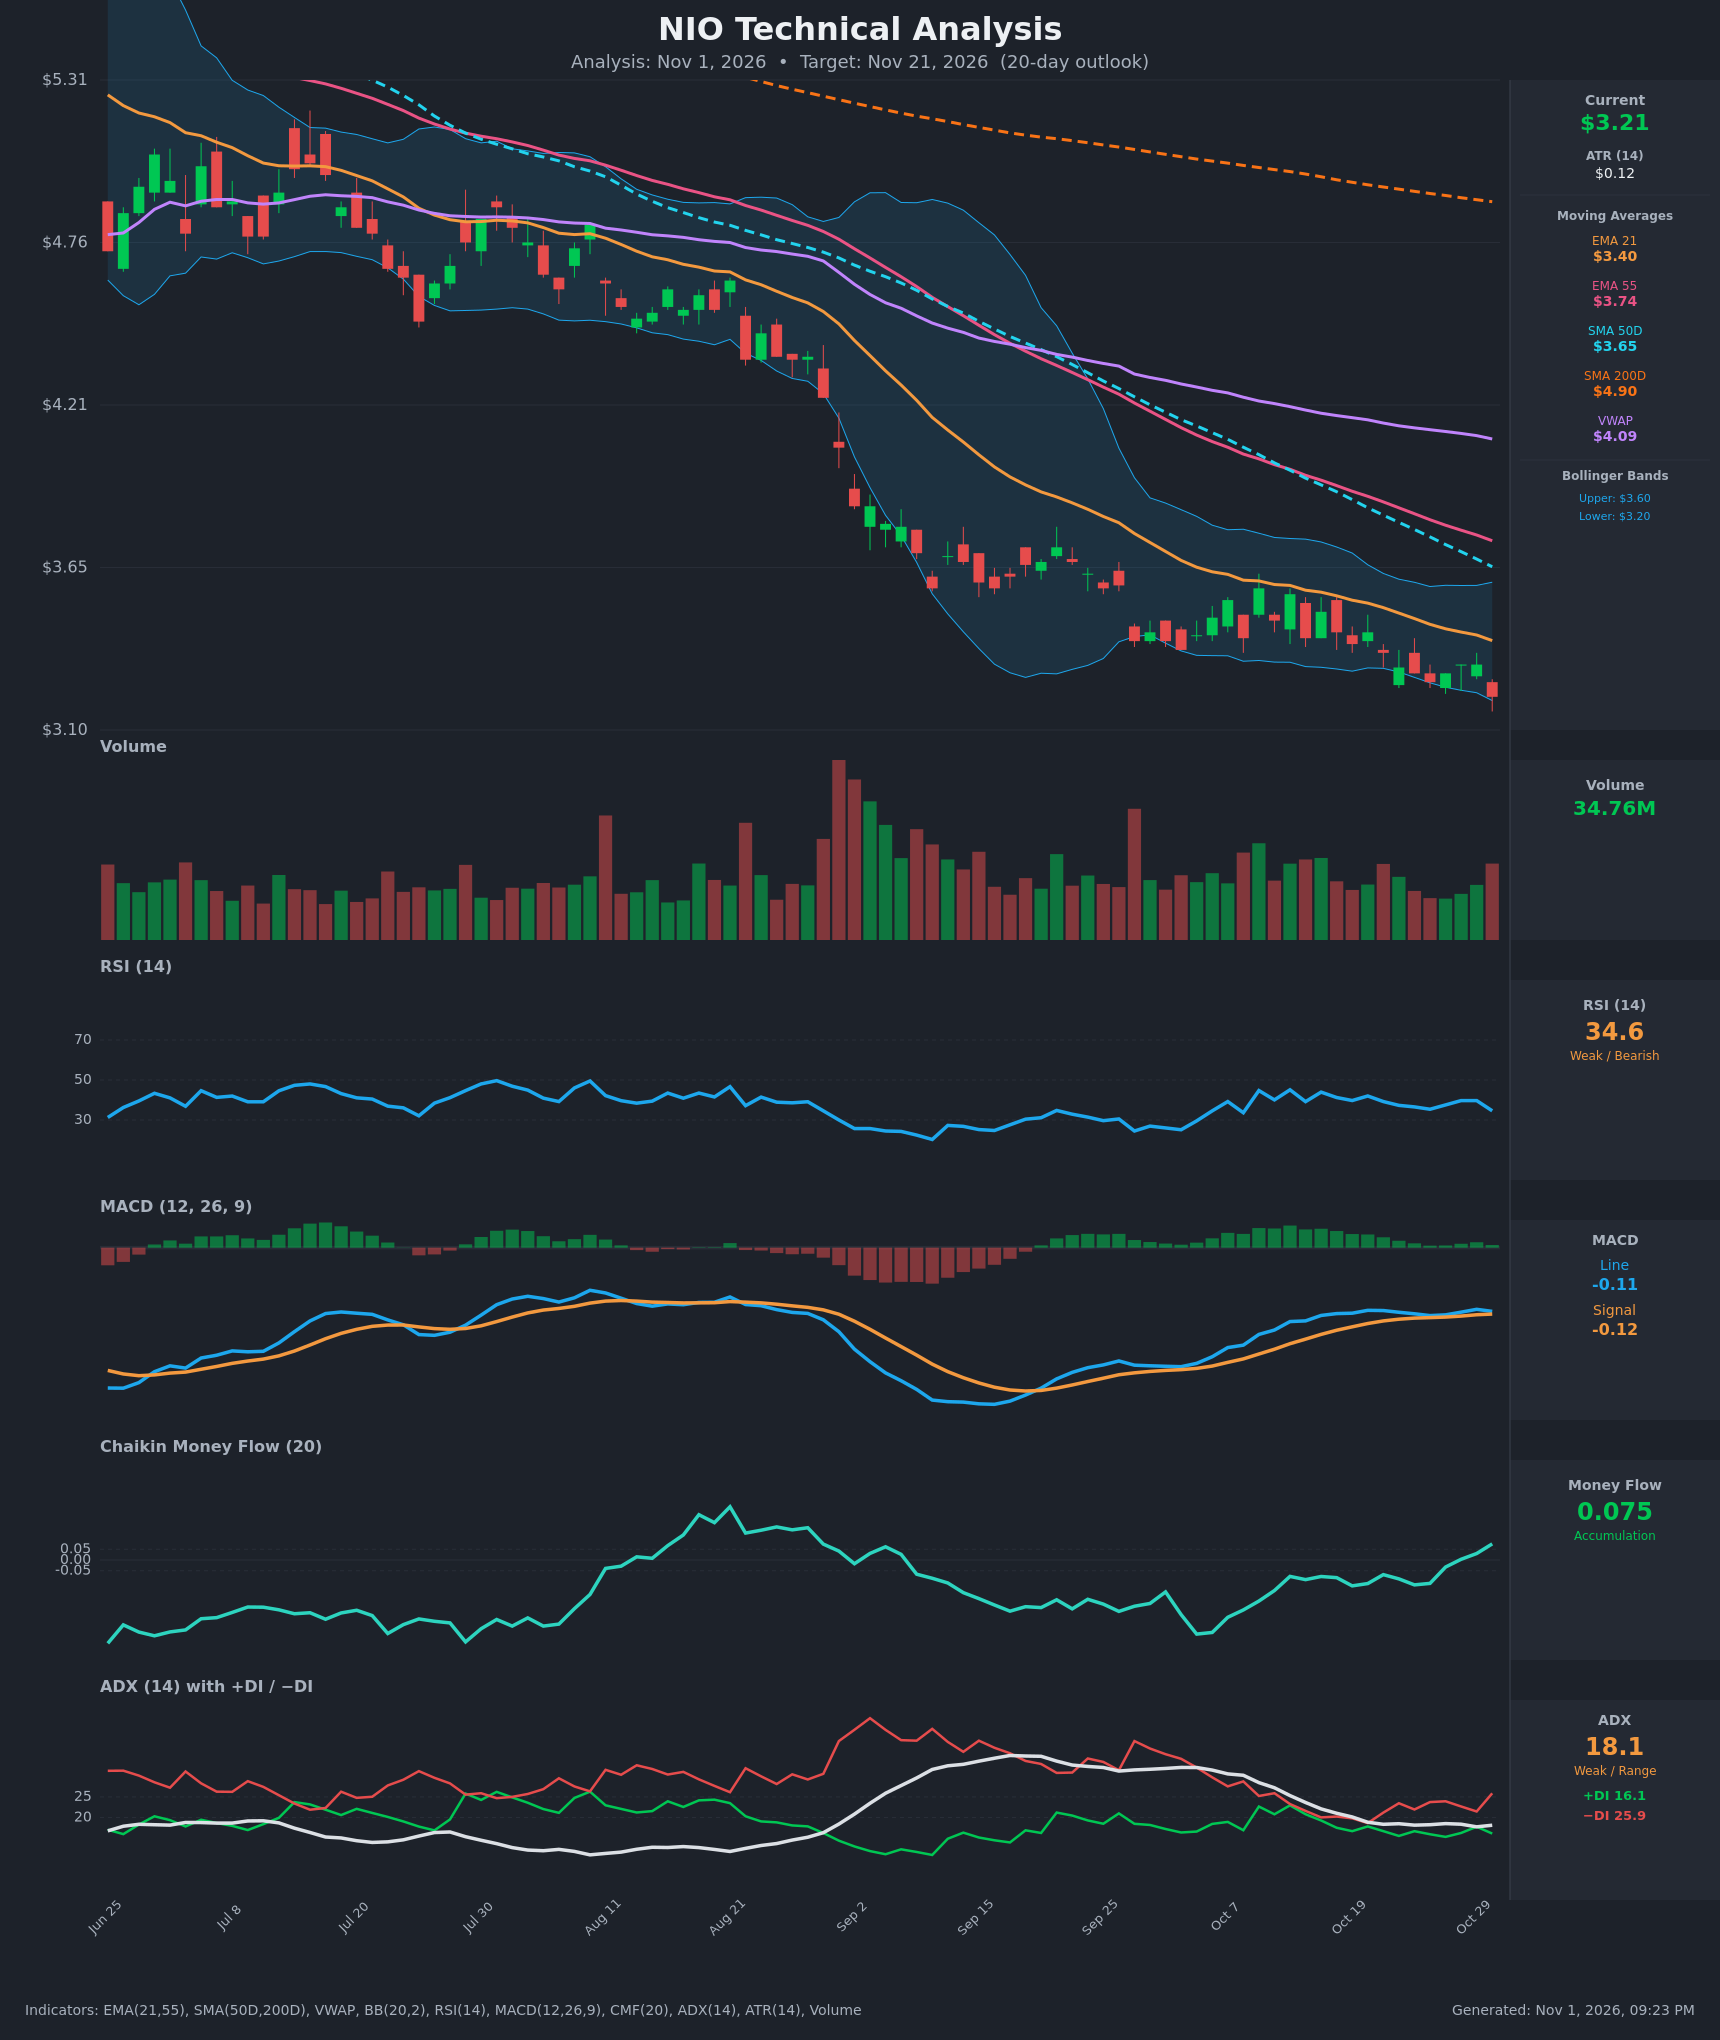
Analysis
TECHNICAL INDICATORS
- RSI (14): 34.60, near the oversold zone but not yet below 30. It dropped from 39.7 to 34.6 in one session and has made lower highs since mid-October (45 → 40 → 39.7). Momentum is weak and still pointing down. [Bearish]
- 20 EMA: The 21 EMA is $3.40, and price at $3.21 is about 5.6% below it. The EMA has declined every day in the table (3.59 → 3.40), so it acts as dynamic resistance. EMA21 is also well below EMA55 ($3.74), a bearish alignment. [Bearish]
- MACD: The line is -0.1119 against a signal of -0.1166, so the histogram is slightly positive. It is a marginal bullish cross inside negative territory. The line has been flat around -0.11 for two weeks, which shows selling momentum fading but no real upside thrust. [Neutral]
- Bollinger Bands (20): Upper is $3.60 and lower is $3.197. Price at $3.21 sits right on the lower band, with the bands compressing and drifting lower. This is a "walking the band" downtrend setup, and it can also set up a mean-reversion bounce toward the $3.40 midline. [Bearish]
- CMF (20): +0.075, rising from -0.143 on Oct 12 and crossing above +0.05. Buying pressure is building even as price makes lower lows. This is the strongest bullish counter-signal on the chart. [Accumulation]
- ADX (14): 18.1, which is weak and range-bound, but −DI (25.9) is clearly above +DI (16.1). The trend lacks strength, yet the directional bias is still with the bears, and −DI just spiked from 21.5 to 25.9. [Weak Trend + Bearish direction]
- Volume: 34.76M, with the latest bar red on above-average volume. Volume on the grind lower has been moderate, with no capitulation spike like the late-August sell-off. The Oct 30 break to a new low on rising volume leans bearish. [Mildly Bearish]
DIVERGENCES & TRENDS
- Bullish CMF divergence: CMF has climbed from -0.14 to +0.075 while price made lower lows ($3.47 → $3.21). This is the main reason a relief bounce is plausible.
- Moving average structure is bearish: Price is below the EMA21 ($3.40), EMA55 ($3.74), SMA50 ($3.65), VWAP ($4.09) and SMA200 ($4.90). SMA50 is far below SMA200, so the death cross is long established. Every average is still sloping down.
- MACD: A tiny bullish cross (line above signal) with a flat, shallow histogram. It confirms deceleration, not reversal.
- RSI: It made a lower high (about 45 on Oct 13, then 39.7 on Oct 28–29) and is rolling over again. There is no bullish RSI divergence versus the September low.
- DI: −DI re-expanded above +DI on Oct 30, and ADX near 18 means the downtrend is a slow grind, not a waterfall.
- Break: Price lost the $3.26 late-October low and closed below the lower Bollinger Band area on Oct 30. Failure to hold the band is a bearish continuation tell.
CHART PATTERNS
- Bearish Flag / Descending Channel (continuation): After the sharp August–September drop, price has drifted in a small, gently descending channel with lower highs ($3.56 → $3.32) and lower lows ($3.26 → $3.21). The break below the $3.26 low is consistent with a bearish flag resolving lower. The measured move from the flag is roughly $3.00 or below.
- Alternative reading, Bullish Falling Wedge: The converging, declining highs and lows could also be read as a falling wedge. The rising CMF supports this, but there is no upside breakout yet. A close above about $3.32–$3.40 would be needed to validate it.
- Overall: The continuation pattern has slightly more weight because the trend, DI and moving averages all agree with it.
POTENTIAL SCENARIOS
- Scenario 1: Bearish Continuation Lower — Price keeps trending down inside the flag/channel, with the EMA21 and lower-band pressure capping any bounce. Trigger: daily close below $3.19 (the lower band and recent low). Target: $3.00–$3.08, with an extension toward $2.95. Invalidation: daily close above $3.40 (EMA21). (50% probability)
- Scenario 2: Bullish Relief Bounce — Rising CMF accumulation and a tag of the lower band spark a mean-reversion rally toward the middle band and EMA21. Trigger: close above $3.32 on rising volume with RSI back above 40. Target: $3.40–$3.55. Invalidation: close back below $3.19. (35% probability)
- Scenario 3: Neutral Range Chop — Weak ADX keeps price pinned between about $3.10 and $3.35 as selling and accumulation offset. Trigger: failure of both breakout levels. Target: $3.15–$3.30. Invalidation: a close beyond $3.05 or $3.40. (15% probability)
PRICE TARGETS
- Target Price: $3.08 (20-day, Nov 21, 2026)
- Expected Range: $2.95 to $3.30 (width $0.35, about 10.9% of current price, consistent with the 14–21 day guidance)
- Key Levels: Support at $3.00, Resistance at $3.40
OVERALL BIAS
OVERALL BIAS: BEARISH - Price is below every moving average, −DI leads +DI, and the breakdown below the $3.26 low on rising volume fits a bearish flag continuation. The rising CMF and the MACD cross keep a relief bounce possible, but the trend evidence outweighs them.
This is educational analysis and not financial advice.