PFE 20-day bullish forecast — Nov 1, 2026
- Bias: Bullish
- Timeframe: 20 days (made Nov 1, 2026, target date Nov 20, 2026)
- Price at analysis: $30.52
- Price target: $31.30
- Expected range: $28.60 – $32.80
- Result: Pending — graded after the close on Nov 20, 2026
Get a free AI analysis of PFE today
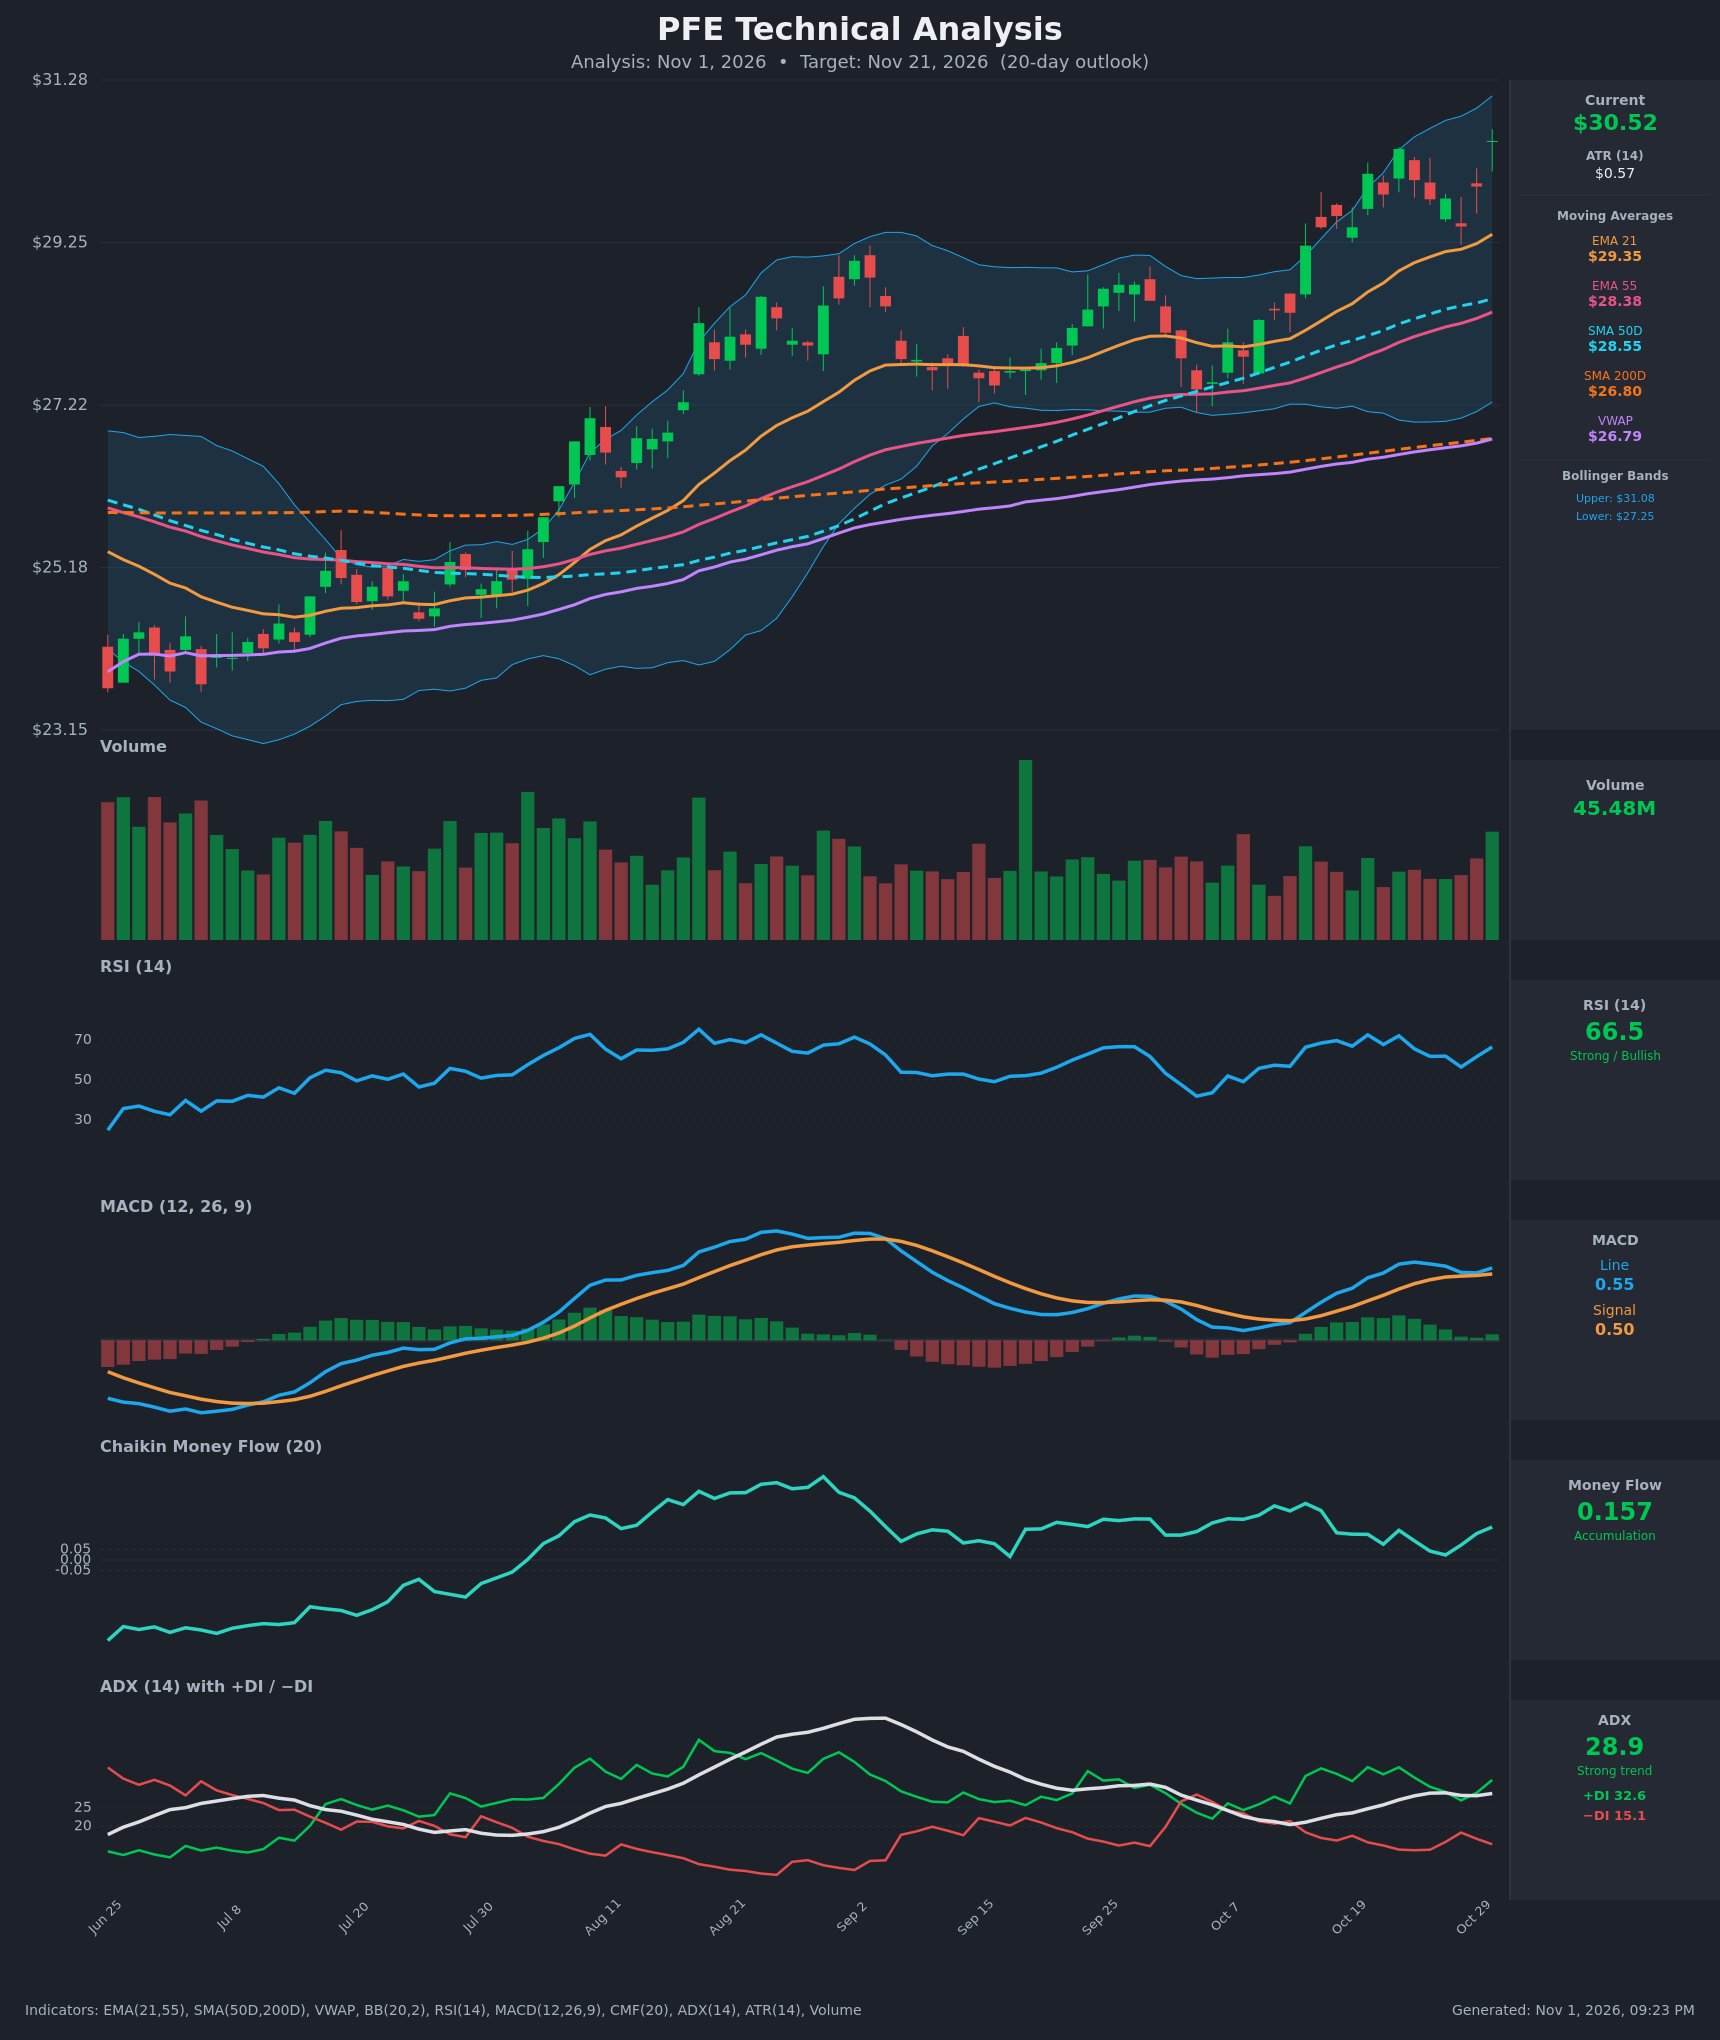
Analysis
TECHNICAL INDICATORS
- RSI (14): 66.54, rebounding from 56.5 on Oct 28 and approaching the 70 overbought line without crossing it. Momentum is strong, with RSI holding above 50 since early October. [Bullish]
- 20 EMA (EMA 21 = $29.35): Price at $30.52 is about 4% above the EMA 21, which is rising and acting as dynamic support. EMA 21 is also above EMA 55 ($28.38), so the short-term trend structure is bullish. [Bullish]
- MACD: Line 0.547 is above Signal 0.5015, so the MACD is positive. The histogram is slightly positive (~0.045) and re-expanding after nearly converging on Oct 28-29 (0.513 vs 0.485). The bullish crossover stayed intact. [Bullish]
- Bollinger Bands (20): Upper $31.08, lower $27.25, middle about $29.17. Price is in the upper quarter of the bands, about $0.56 below the upper band. Bands are widening and price is walking the upper half, which signals a trend, though the stretch raises the odds of a brief pullback. [Bullish]
- CMF (20): 0.157, well above +0.05 and rebounding from 0.024 on Oct 27. It signals sustained accumulation, though it is below the 0.25 readings from mid-October. [Accumulation]
- ADX (14): 28.9 and rising slightly from 28.3. +DI 32.6 is far above −DI 15.1, which marks a strong uptrend with bulls in control. [Strong Trend + Bullish]
- Volume: 45.48M, the highest in about two weeks, on a green up-close. This shows participation on the push to new highs. Price is also well above VWAP ($26.79) and SMA200D ($26.80). [Bullish - Confirms Breakout]
DIVERGENCES & TRENDS
- No bearish RSI or MACD divergence. Price made higher highs (Oct 22 $30.42, Oct 30 $30.52). RSI is lower than its Oct 20 peak (72.6) and MACD is just above its Oct 23 level, so momentum is not accelerating as fast as price. This is a mild caution, not a true divergence.
- The MA stack is fully bullish: price > EMA21 > SMA50D ($28.55) > EMA55 > SMA200D ($26.80) > VWAP. SMA50D is well above SMA200D, so the golden cross is already in place.
- MACD nearly crossed down on Oct 28 (histogram +0.028) but held and turned back up, a bullish retest of the signal line.
- ADX rose from about 20 to 29 as +DI separated from −DI. The trend is maturing but still strengthening.
- The Oct 28 pullback to $29.45 held above EMA21, a typical shallow trend pullback.
CHART PATTERNS
- Ascending channel / higher-highs staircase: Since the Aug-Oct consolidation, price has made higher lows ($27.2 early Oct) and now higher highs, a trend-continuation structure.
- Bullish continuation (flag-like): The Oct 22-28 pullback was a shallow, slightly downward-sloping consolidation, similar to the Bullish Flag Pattern in the reference diagram. The Oct 30 move to $30.52 is the breakout. Measuring the flagpole (~$27.5 to ~$30.4, about $2.9) suggests an upside target of about $32-33, but this is optimistic over 20 days.
- Resistance: the upper Bollinger Band ($31.08) and the prior swing high zone ($30.42-30.60). Price is pressing the top of the range with no reversal pattern (double top or head and shoulders) visible.
POTENTIAL SCENARIOS
- Scenario 1: Bullish Trend Continuation — Price breaks the $30.60 and $31.08 band zone on strong volume and ADX holds above 25 and rises. Trigger: a daily close above $31.10 with CMF above 0.10. Target: $32.00-$32.80 (flag measured-move area). Invalidation: a close below EMA21 (~$29.35). (50% probability)
- Scenario 2: Neutral/Bullish Consolidation Then Grind — Price is overbought near the upper band, pulls back to $29.40-$30.00 (EMA21 and band midline), then resumes the uptrend, ending slightly above current levels. Trigger: RSI above 70 with rejection near $31. Target: $30.00-$31.00. Invalidation: a close above $31.50 or below $28.50. (30% probability)
- Scenario 3: Bearish Reversal — A failed breakout takes price back below the EMA21, MACD crosses down and the CMF fades. Trigger: a close below $29.35 on higher volume. Target: $28.40-$28.60 (SMA50D/EMA55). Invalidation: a reclaim of $30.50. (20% probability)
PRICE TARGETS
For the 20-day horizon (to Nov 21, 2026), the bullish structure supports a modestly higher target. ATR of $0.57 implies a typical 20-day move of about ±$2.5 (1 sigma), and the stretched RSI argues for a conservative target.
- Target Price: $31.30 (20-day)
- Expected Range: $28.60 to $32.80 (width $4.20 = about 13.8% of current price, consistent with the ~8-12%+ guidance for 14-21 days given the elevated volatility)
- Key Levels: Support at $29.35 (EMA 21), Resistance at $31.08 (upper Bollinger Band)
OVERALL BIAS
OVERALL BIAS: BULLISH - Price is above all key moving averages, ADX is at 28.9 with +DI far above −DI, MACD is positive above its signal, CMF shows accumulation, and the latest push came on rising volume. The main risk is a short-term pullback to EMA21 given RSI near 70 and price near the upper Bollinger Band.
This is educational analysis and not financial advice.