QUBT 20-day bearish forecast — Nov 1, 2026
- Bias: Bearish
- Timeframe: 20 days (made Nov 1, 2026, target date Nov 20, 2026)
- Price at analysis: $6.60
- Price target: $6.20
- Expected range: $5.60 – $7.30
- Result: Pending — graded after the close on Nov 20, 2026
Get a free AI analysis of QUBT today
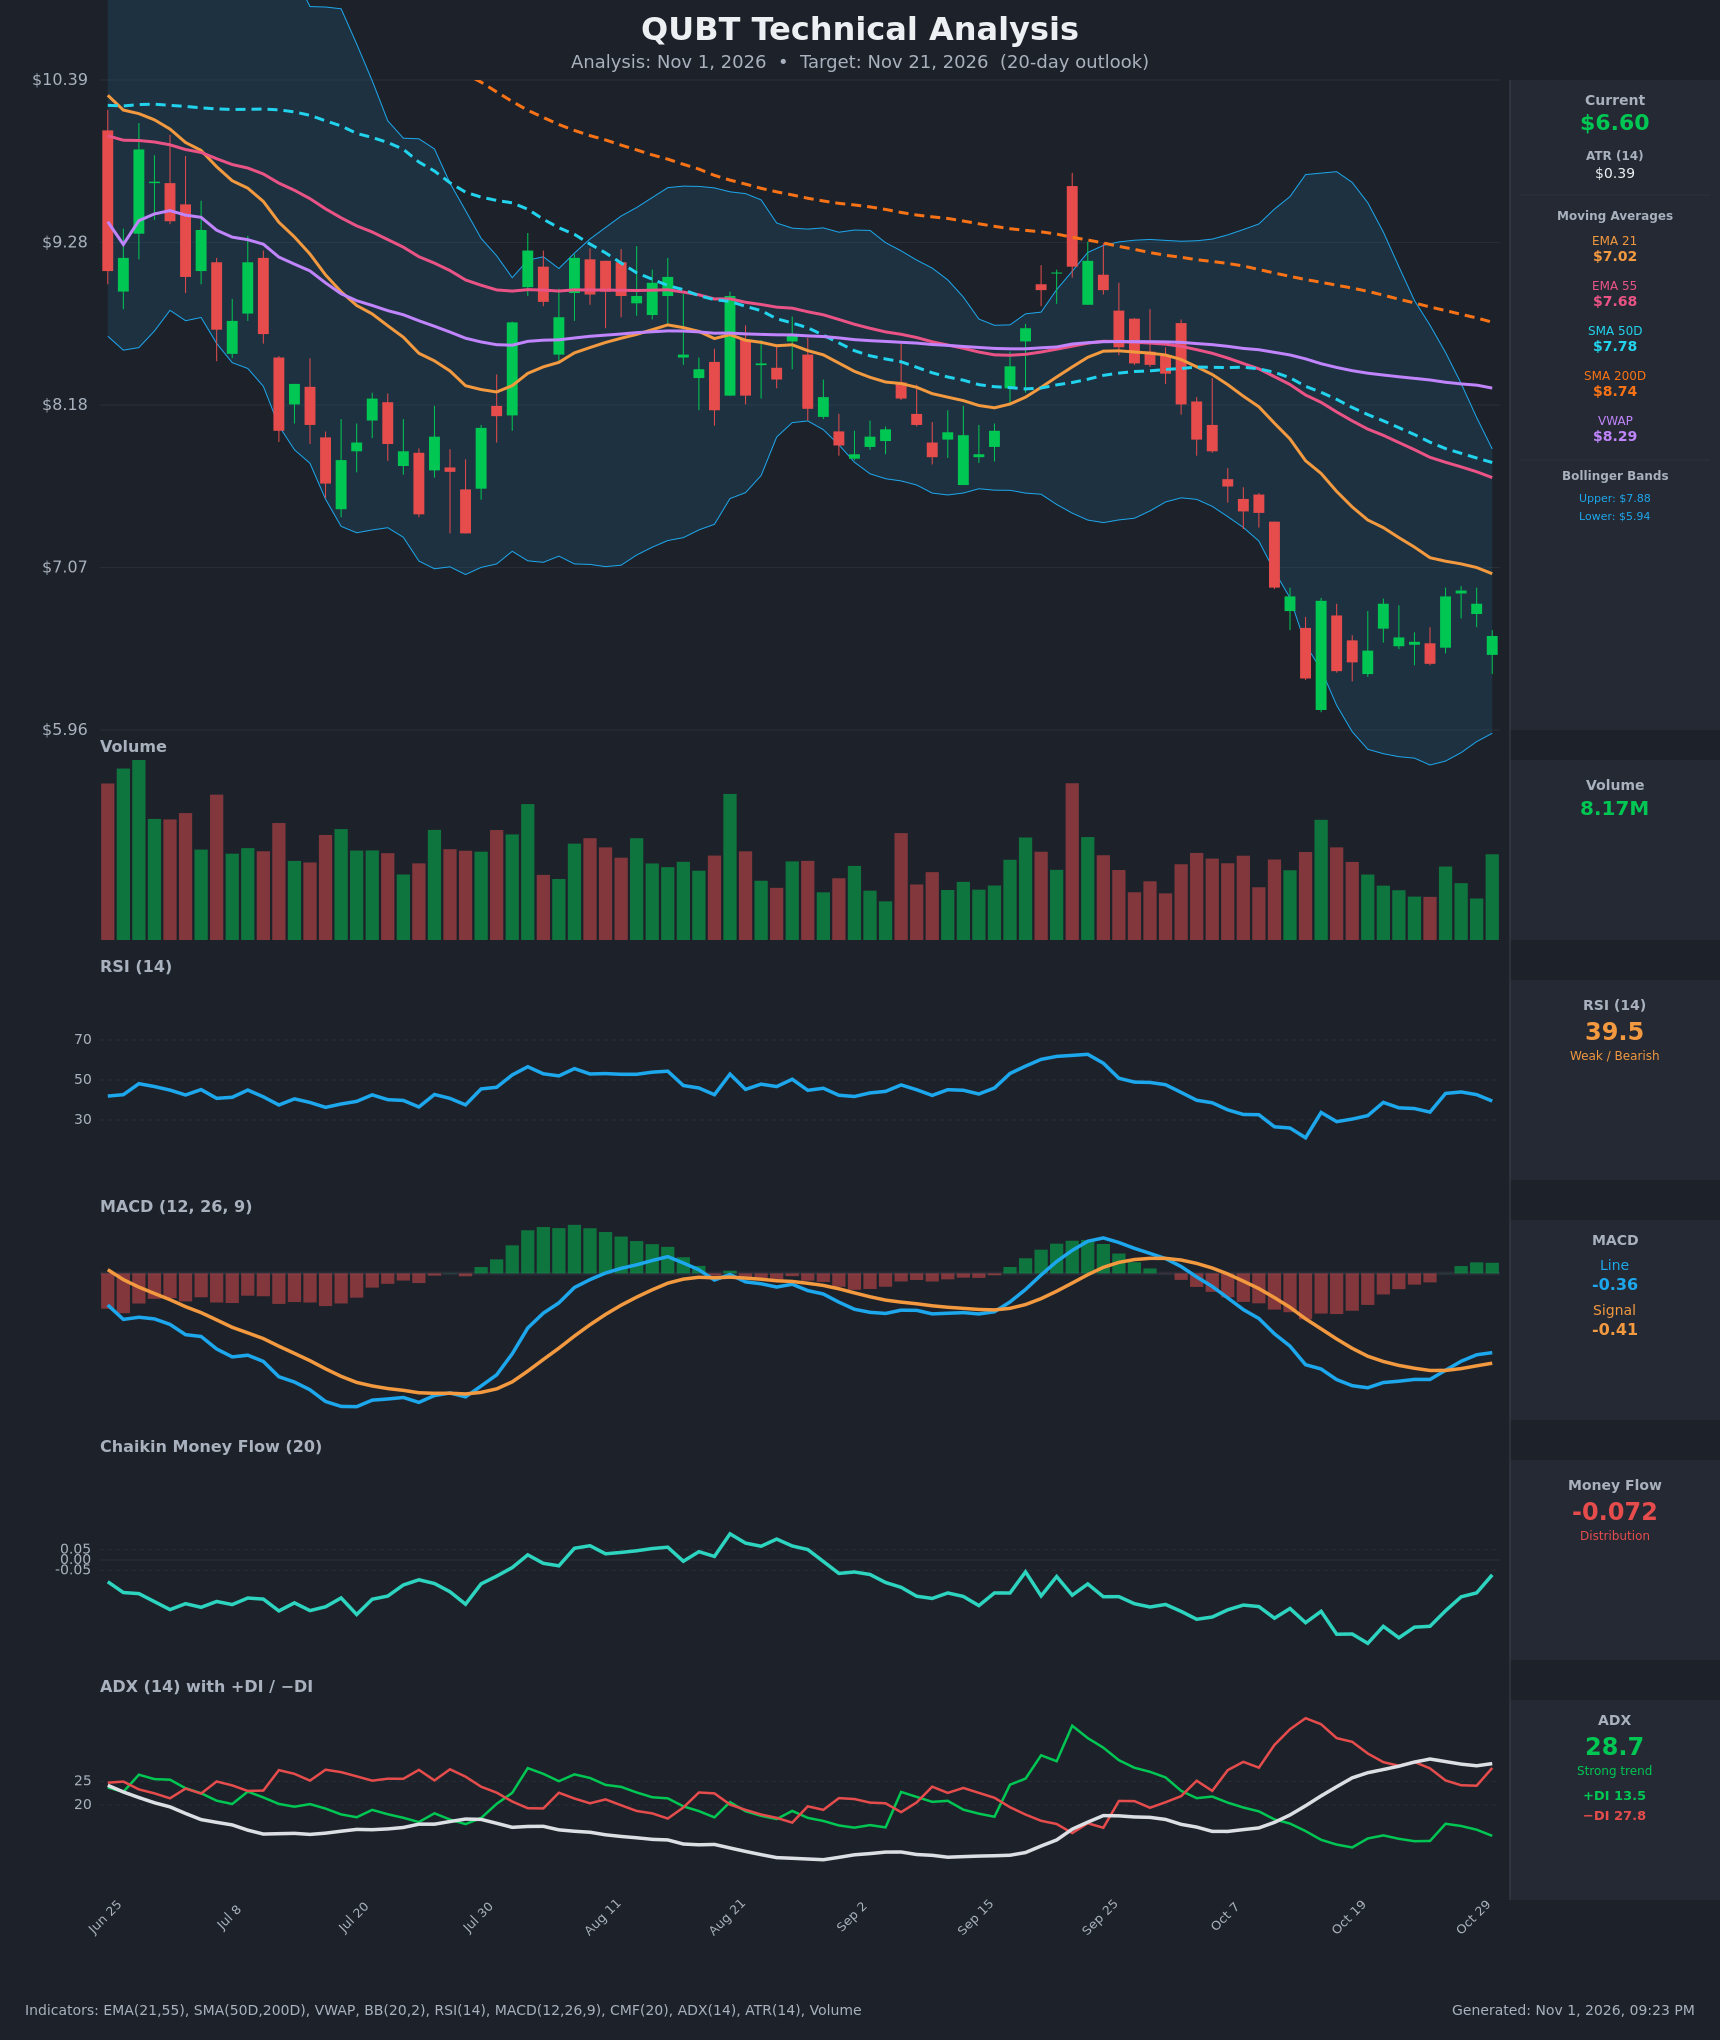
Analysis
TECHNICAL INDICATORS
- RSI (14): 39.48, below the 50 midline but recovering from the 21.1 oversold low on Oct 14. It has bounced to 43-44 and rolled over again. Momentum is weak but not oversold. [Bearish]
- 20 EMA: EMA 21 is $7.02, with price at $6.60 below it. The EMA is sloping down and has acted as resistance on every bounce. EMA 21 is also below EMA 55 ($7.68), so the short-term structure is bearish. [Bearish]
- MACD: Line -0.364 is above Signal -0.413, so the histogram is slightly positive. It turned positive on Oct 27 as the line crossed above the signal. Both lines remain below zero, so this is a mild bullish momentum recovery inside a downtrend. [Neutral]
- Bollinger Bands (20): Upper $7.88, lower $5.94, with the midline near $6.90. Price at $6.60 is in the lower half and about 34% of the way up the band range. The Oct 16 flush through the lower band was followed by a bounce. Bands have been compressing after the selloff. [Neutral]
- CMF (20): -0.072, below the -0.05 threshold. It has improved from -0.40 but remains in distribution, so sellers still dominate. [Distribution]
- ADX (14): 28.7 with −DI 27.8 above +DI 13.5. ADX is above 25, so the trend is strong, and it is bearish since −DI dominates. The gap between the DIs has narrowed from the peak (38 vs. 12), a sign of fading downside momentum. [Strong Trend - Bearish]
- Volume: 8.17M. Volume is fading on the consolidation near $6.40-$6.90, with no capitulation spike since the Oct breakdown. The latest green candle shows a modest uptick. This is a low-volume basing attempt, not a confirmed reversal. [Neutral]
Other trend context:
- Price vs. moving averages: Price is below all of them: EMA 21 ($7.02), EMA 55 ($7.68), SMA 50D ($7.78), VWAP ($8.29) and SMA 200D ($8.74).
- SMA crossover: SMA 50D is below SMA 200D, so a death cross is in place and the long-term trend is down.
DIVERGENCES & TRENDS
- RSI divergence: Price made lower lows around $6.31-$6.36 on Oct 14-16. RSI went from 21.1 to 29.2, a mild bullish divergence that has helped stabilize price. The RSI rejection under 45 shows the bounce has not turned into a trend change.
- MACD: The bullish crossover on Oct 27 came below the zero line. It is a relief signal, but histogram strength is minimal.
- CMF: It is improving, from -0.40 to -0.07, while price moves sideways. This is a mild positive, but it has not crossed above zero.
- ADX/DI: ADX is still above 25 but has plateaued. −DI is declining while +DI is rising slightly, so downside pressure is easing.
- Moving averages: All are stacked bearishly (EMA 21 < EMA 55 < SMA 50D < VWAP < SMA 200D) and falling. They form a layered overhead resistance zone from $7.02 to $7.78.
CHART PATTERNS
- Bearish Pennant / Flag-like consolidation: After the sharp drop from about $8.0 to $6.3, price has been consolidating in a tight range of about $6.31-$6.93 with lower volume. Per the reference diagram, a bearish continuation would break below the range. The measured target is about $5.60-$5.90, in the area of the lower Bollinger Band ($5.94).
- Bullish Double Bottom (minor): Lows at $6.31 (Oct 14) and $6.36-$6.41 (Oct 16 and Oct 26) form a possible double-bottom base, with a neckline near $6.93. A close above it would target about $7.50, but the pattern is not confirmed yet.
- Net read: The downtrend (strong ADX, death cross, stacked MAs) makes bearish continuation the higher-probability resolution. The double bottom is a lower-probability reversal.
POTENTIAL SCENARIOS
- Scenario 1: Bearish Continuation Breakdown — Price fails to clear EMA 21 at $7.02, then breaks the $6.31-$6.40 support base. The strong ADX and −DI dominance and the distribution CMF support further downside. Trigger: daily close below $6.30. Target: $5.70-$5.90, near the lower Bollinger Band. Invalidation: daily close above $7.05. (50% probability)
- Scenario 2: Neutral Range-Bound Chop — Price stays between $6.30 and $7.00 while the indicators reset. Trigger: failed breaks of both $6.30 and $6.93. Target: $6.40-$6.90. Invalidation: close outside $6.30-$7.05. (20% probability)
- Scenario 3: Bullish Double-Bottom Relief Rally — The MACD crossover, improving CMF and RSI divergence fuel a bounce through the $6.93 neckline. The rally is capped by the EMA 21 and EMA 55 cluster. Trigger: close above $7.05 on rising volume. Target: $7.60-$7.80, at EMA 55 and SMA 50D. Invalidation: close below $6.40. (30% probability)
PRICE TARGETS
- Target Price: $6.20 (20-day horizon)
- Expected Range: $5.60 to $7.30 (width $1.70 = 25.8% of price, scaled for a high-volatility 20-day window with ATR of about $0.39, or about 6% daily)
- Key Levels: Support at $6.31, Resistance at $7.02
Self-check: the 20-day range is much wider than a 3-day (2-4%) or 14-day (8-12%) range. It is slightly above the 8-12% baseline because the stock is highly volatile (ATR about 5.9% of price), and the width is consistent with a bearish-skewed distribution. The target of $6.20 is below the current $6.60, consistent with a bearish bias.
OVERALL BIAS
OVERALL BIAS: BEARISH - A strong ADX with −DI dominant, a death cross, price below all key moving averages and CMF still in distribution outweigh the minor MACD crossover and RSI divergence. The low-volume consolidation near $6.30-$6.90 looks more like a bearish continuation pause than a confirmed base.
This is educational analysis and not financial advice.