SLV 20-day bullish forecast — Nov 1, 2026
- Bias: Bullish
- Timeframe: 20 days (made Nov 1, 2026, target date Nov 20, 2026)
- Price at analysis: $44.60
- Price target: $46.40
- Expected range: $42.80 – $48.00
- Result: Pending — graded after the close on Nov 20, 2026
Get a free AI analysis of SLV today
Analysis
TECHNICAL INDICATORS
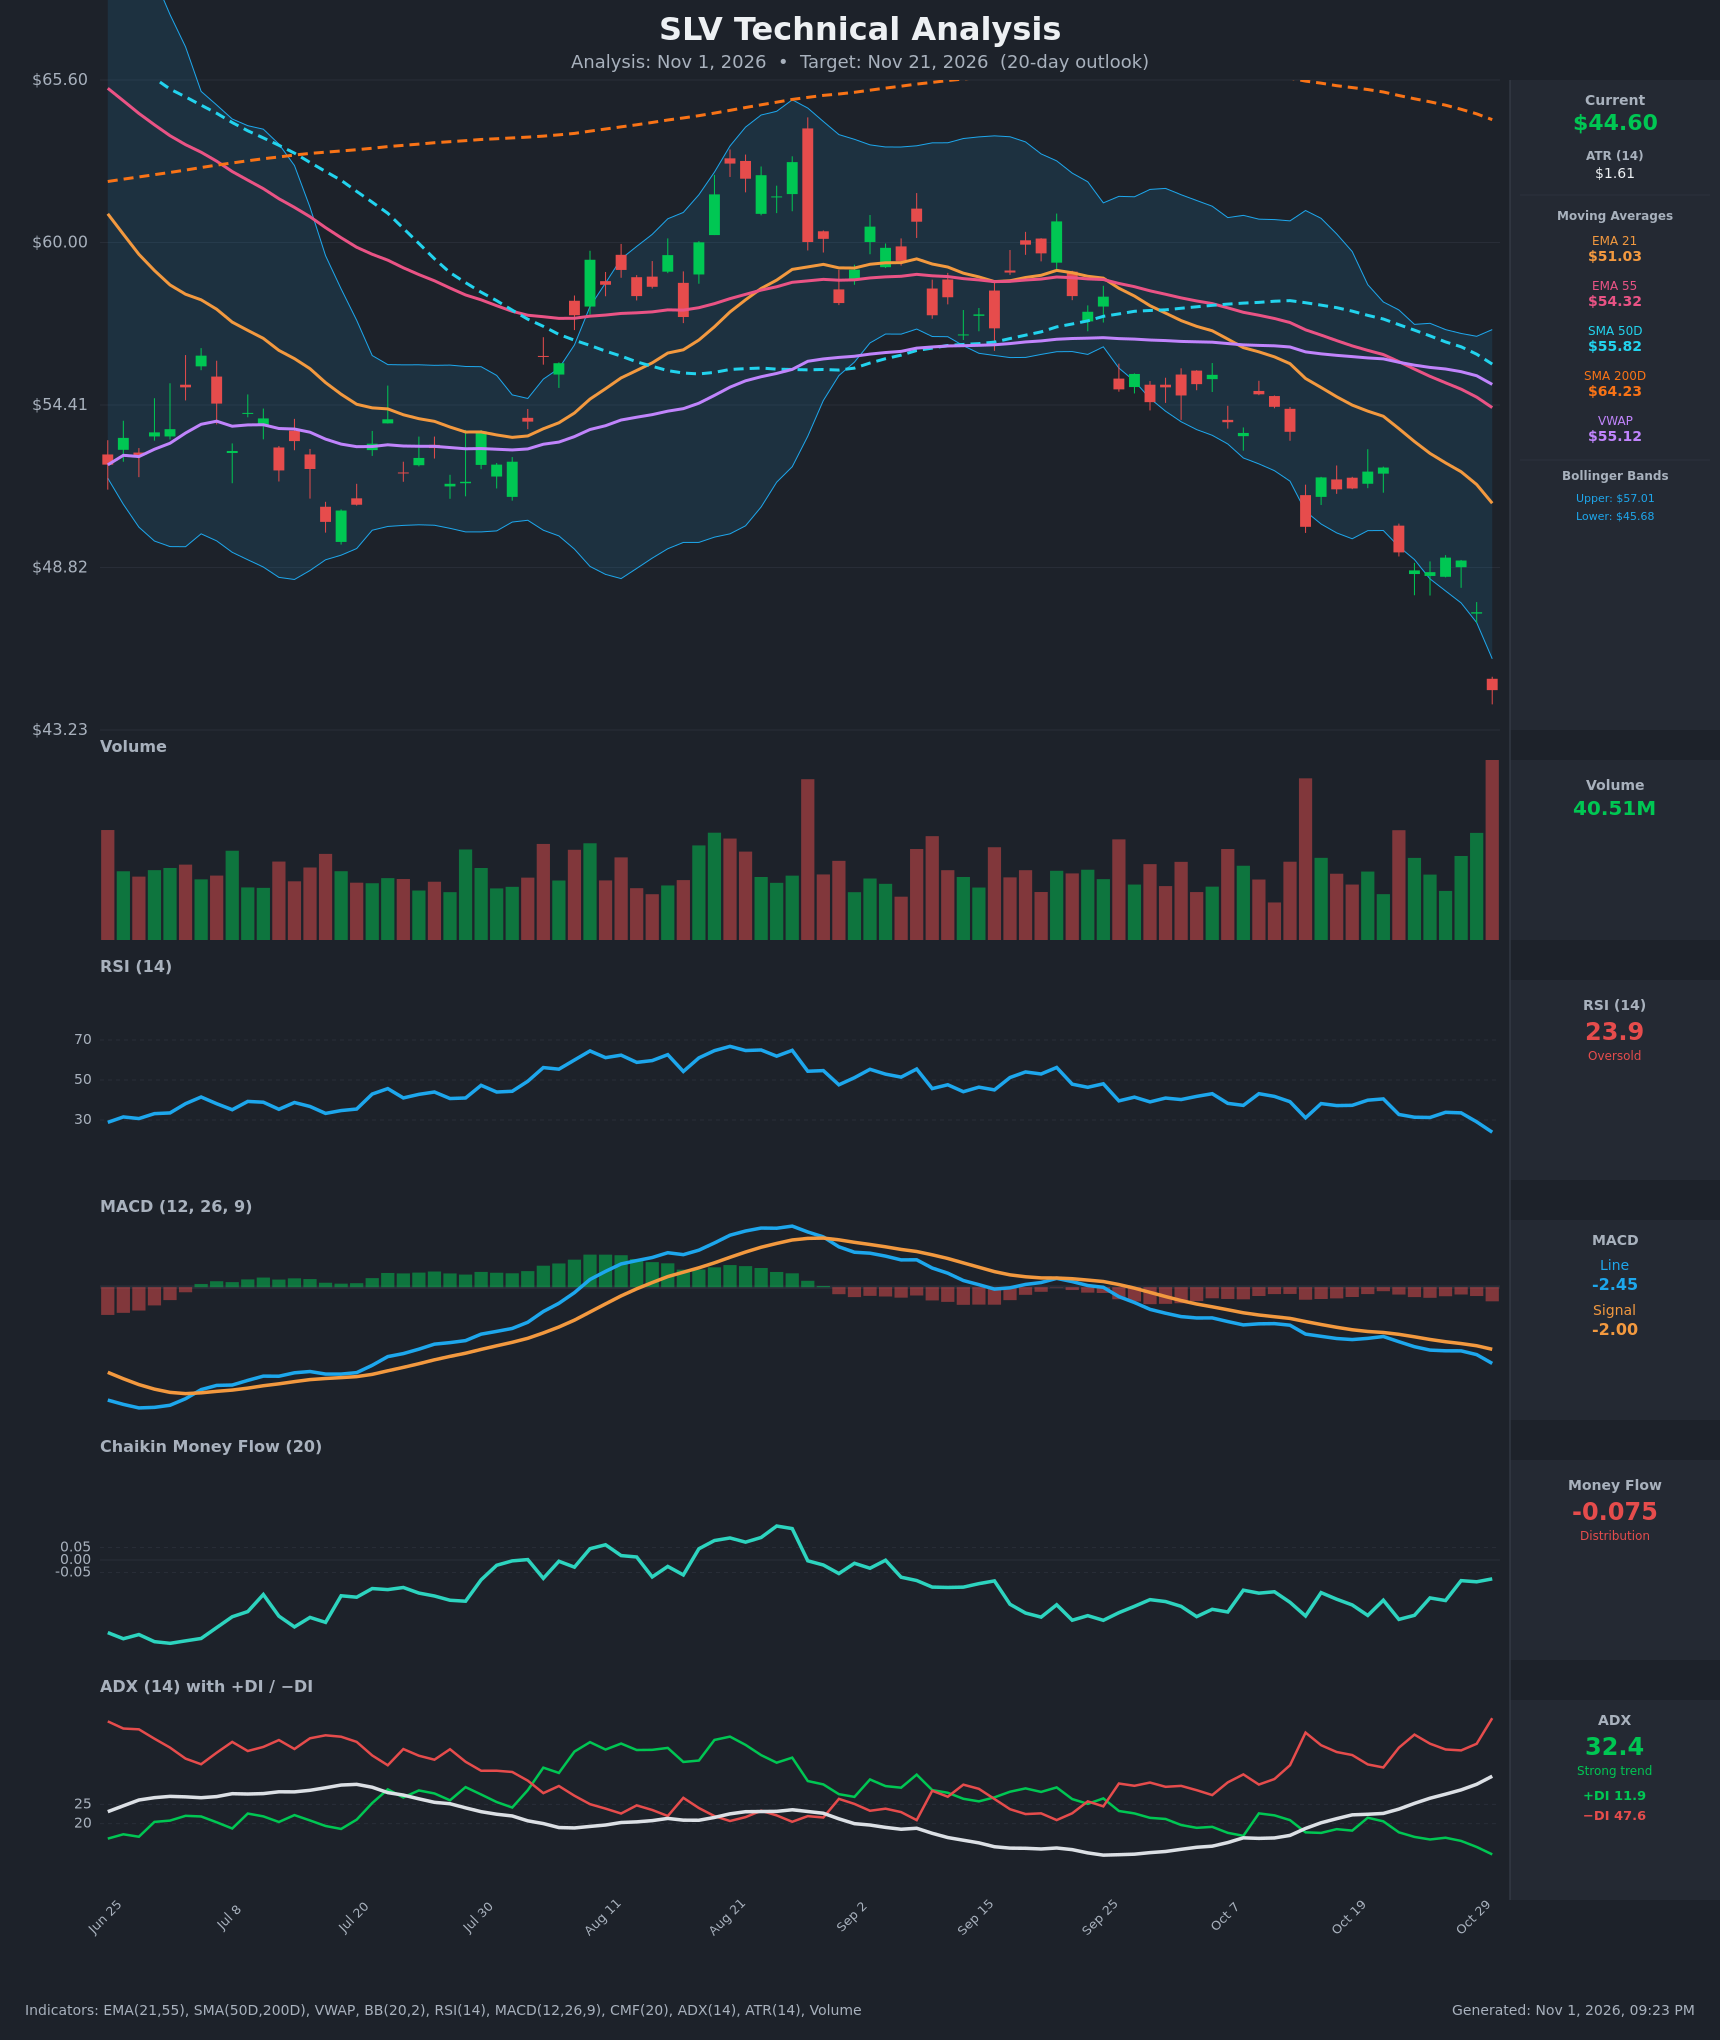
- RSI (14): 23.90, deeply oversold and down from 41.8 on Oct 12. It has made lower lows alongside price, so momentum is still falling, but this is the lowest reading in the visible history. [Bullish] (oversold, but no divergence yet)
- 20 EMA: The supplied EMA 21 is $51.03 and price at $44.60 is about 12.6% below it. The EMA is sloping down and acts as overhead resistance. EMA 21 is also well below EMA 55 ($54.32), a bearish stack. [Bearish]
- MACD: Line -2.452 is below signal -1.998, and the histogram is widening negative. The line crossed below the signal in early September and the gap has been widening since, so bearish momentum is accelerating. [Bearish]
- Bollinger Bands (20): Upper $57.01, lower $45.68. Price at $44.60 is closed below the lower band, and the bands are expanding downward, which is a "band walk" in a strong downtrend. A close this far outside the band is statistically stretched and often leads to a snap-back to the mid-band, but it is not a reversal signal on its own. [Neutral] (stretched, but trend-confirming)
- CMF (20): -0.075, below the -0.05 threshold, so mild distribution. It has improved from -0.237 on Oct 22 even as price fell, so selling pressure is easing. [Distribution]
- ADX (14): 32.4 and rising from 16 two weeks ago, a strong and strengthening trend. −DI (47.6) is far above +DI (11.9), so sellers are in firm control. [Strong Trend – Bearish]
- Volume: 40.51M, the highest bar on the chart, on a wide red candle that broke below the lower band. This is heavy, capitulation-style volume. It confirms the selling force, but it is also the kind of climax volume that often appears near short-term exhaustion. [Bearish confirmation / possible climax]
Other trend context:
- Moving averages: SMA50D ($55.82) is below SMA200D ($64.23), so the death cross is in force. Price is below every moving average and VWAP ($55.12).
- Long-term trend: Price is about 31% below the SMA200D, so the long-term trend is firmly down.
DIVERGENCES & TRENDS
- CMF: A mild bullish divergence is forming. CMF rose from -0.237 (Oct 22) to -0.075 while price fell from $49.34 to $44.60. Selling is losing efficiency, but this is not yet confirmed by price.
- RSI: No bullish divergence. RSI made a new low (23.9) with price, which confirms the momentum.
- MACD: The histogram is expanding negative and both lines are falling. This is classic bearish continuation with no sign of a turn.
- DI and ADX: −DI is hitting new highs and ADX is rising through 30, so the trend is accelerating. Extreme −DI readings (above 45) and ADX above 30 often coincide with late-stage moves, which raises the odds of a relief bounce.
- Crossovers: The death cross (SMA50D below SMA200D) and EMA21 below EMA55 are both established. EMA21 and EMA55 are widening apart, so there is no sign of a trend change.
- Stretch: Price is about 12.6% below EMA21 and about 2.4% below the lower Bollinger Band. This is extremely extended after a roughly 18% drop in 13 sessions.
CHART PATTERNS
- Bearish Flag / Pennant (continuation): The tight Oct 15–21 consolidation around $51.5–52.3 resolved downward. This matches the bearish flag/pennant from the reference diagram. The measured move from the pole has already largely played out, with price near $44.60.
- Descending channel: Lower highs and lower lows since mid-October, with price walking the lower Bollinger Band. This is a trend-continuation structure, not a reversal pattern.
- No reversal pattern: There is no double bottom, inverted H&S, or falling-wedge breakout yet. A falling-wedge-type reversal would need decelerating lows and a break above the descending trendline, roughly the $48.7–49.3 area.
- Overall: The pattern evidence favors continuation, but the extreme oversold stretch with a climax-volume bar makes a counter-trend rebound within the downtrend likely.
POTENTIAL SCENARIOS
- Scenario 1: Bullish Oversold Relief Bounce — Climactic volume, RSI below 24 and a close well outside the lower Bollinger Band are consistent with short-term exhaustion. Price mean-reverts toward the broken $46–48.7 zone but stays below the falling EMA21 (about $50–51) and the main downtrend. Trigger: close back above the lower band ($45.68) and a higher low above $43.2. Target: $46.40–$48.70. Invalidation: daily close below $43.00. (47% probability)
- Scenario 2: Bearish Trend Continuation — ADX is above 30, −DI is dominant, MACD is still widening, and all moving averages are overhead. Sellers keep pressing with minor bounces failing at $45.7–46.5. Trigger: failure to reclaim $45.68 and a break below the recent low (about $44.3). Target: $41.50–$43.00. Invalidation: daily close above $48.70. (40% probability)
- Scenario 3: Neutral Base Building — Price chops between roughly $43.5 and $47.5 as selling exhausts but buyers lack conviction. Trigger: low-volume, small-range candles after the spike. Target: $45–46.50. Invalidation: close outside $43.00–$48.70. (13% probability)
PRICE TARGETS
- Target Price: $46.40 (20-day, about +4% from $44.60, a partial relief bounce)
- Expected Range: $42.80 to $48.00 (width $5.20, about 11.7% of the current price, consistent with the 14–21 day guidance)
- Key Levels: Support at $43.00, Resistance at $45.68. The next resistance zone is $48.70–$49.30, and the falling EMA21 sits near $51.
OVERALL BIAS
OVERALL BIAS: BULLISH - Price is extremely stretched: RSI 23.9, a close below the lower Bollinger Band, a record-volume flush, about 12.6% below EMA21, and a CMF that is improving even as price falls. This favors a partial relief bounce toward about $46.40. The conviction is modest because ADX above 30, a dominant −DI, the death cross and a widening bearish MACD show a strong downtrend that could easily extend toward $42–43.
This is educational analysis and not financial advice.