ARM 27-day bearish forecast — Nov 1, 2026
- Bias: Bearish
- Timeframe: 27 days (made Nov 1, 2026, target date Nov 27, 2026)
- Price at analysis: $205.97
- Price target: $195.00
- Expected range: $176.00 – $212.00
- Result: Pending — graded after the close on Nov 27, 2026
Get a free AI analysis of ARM today
Analysis
TECHNICAL INDICATORS
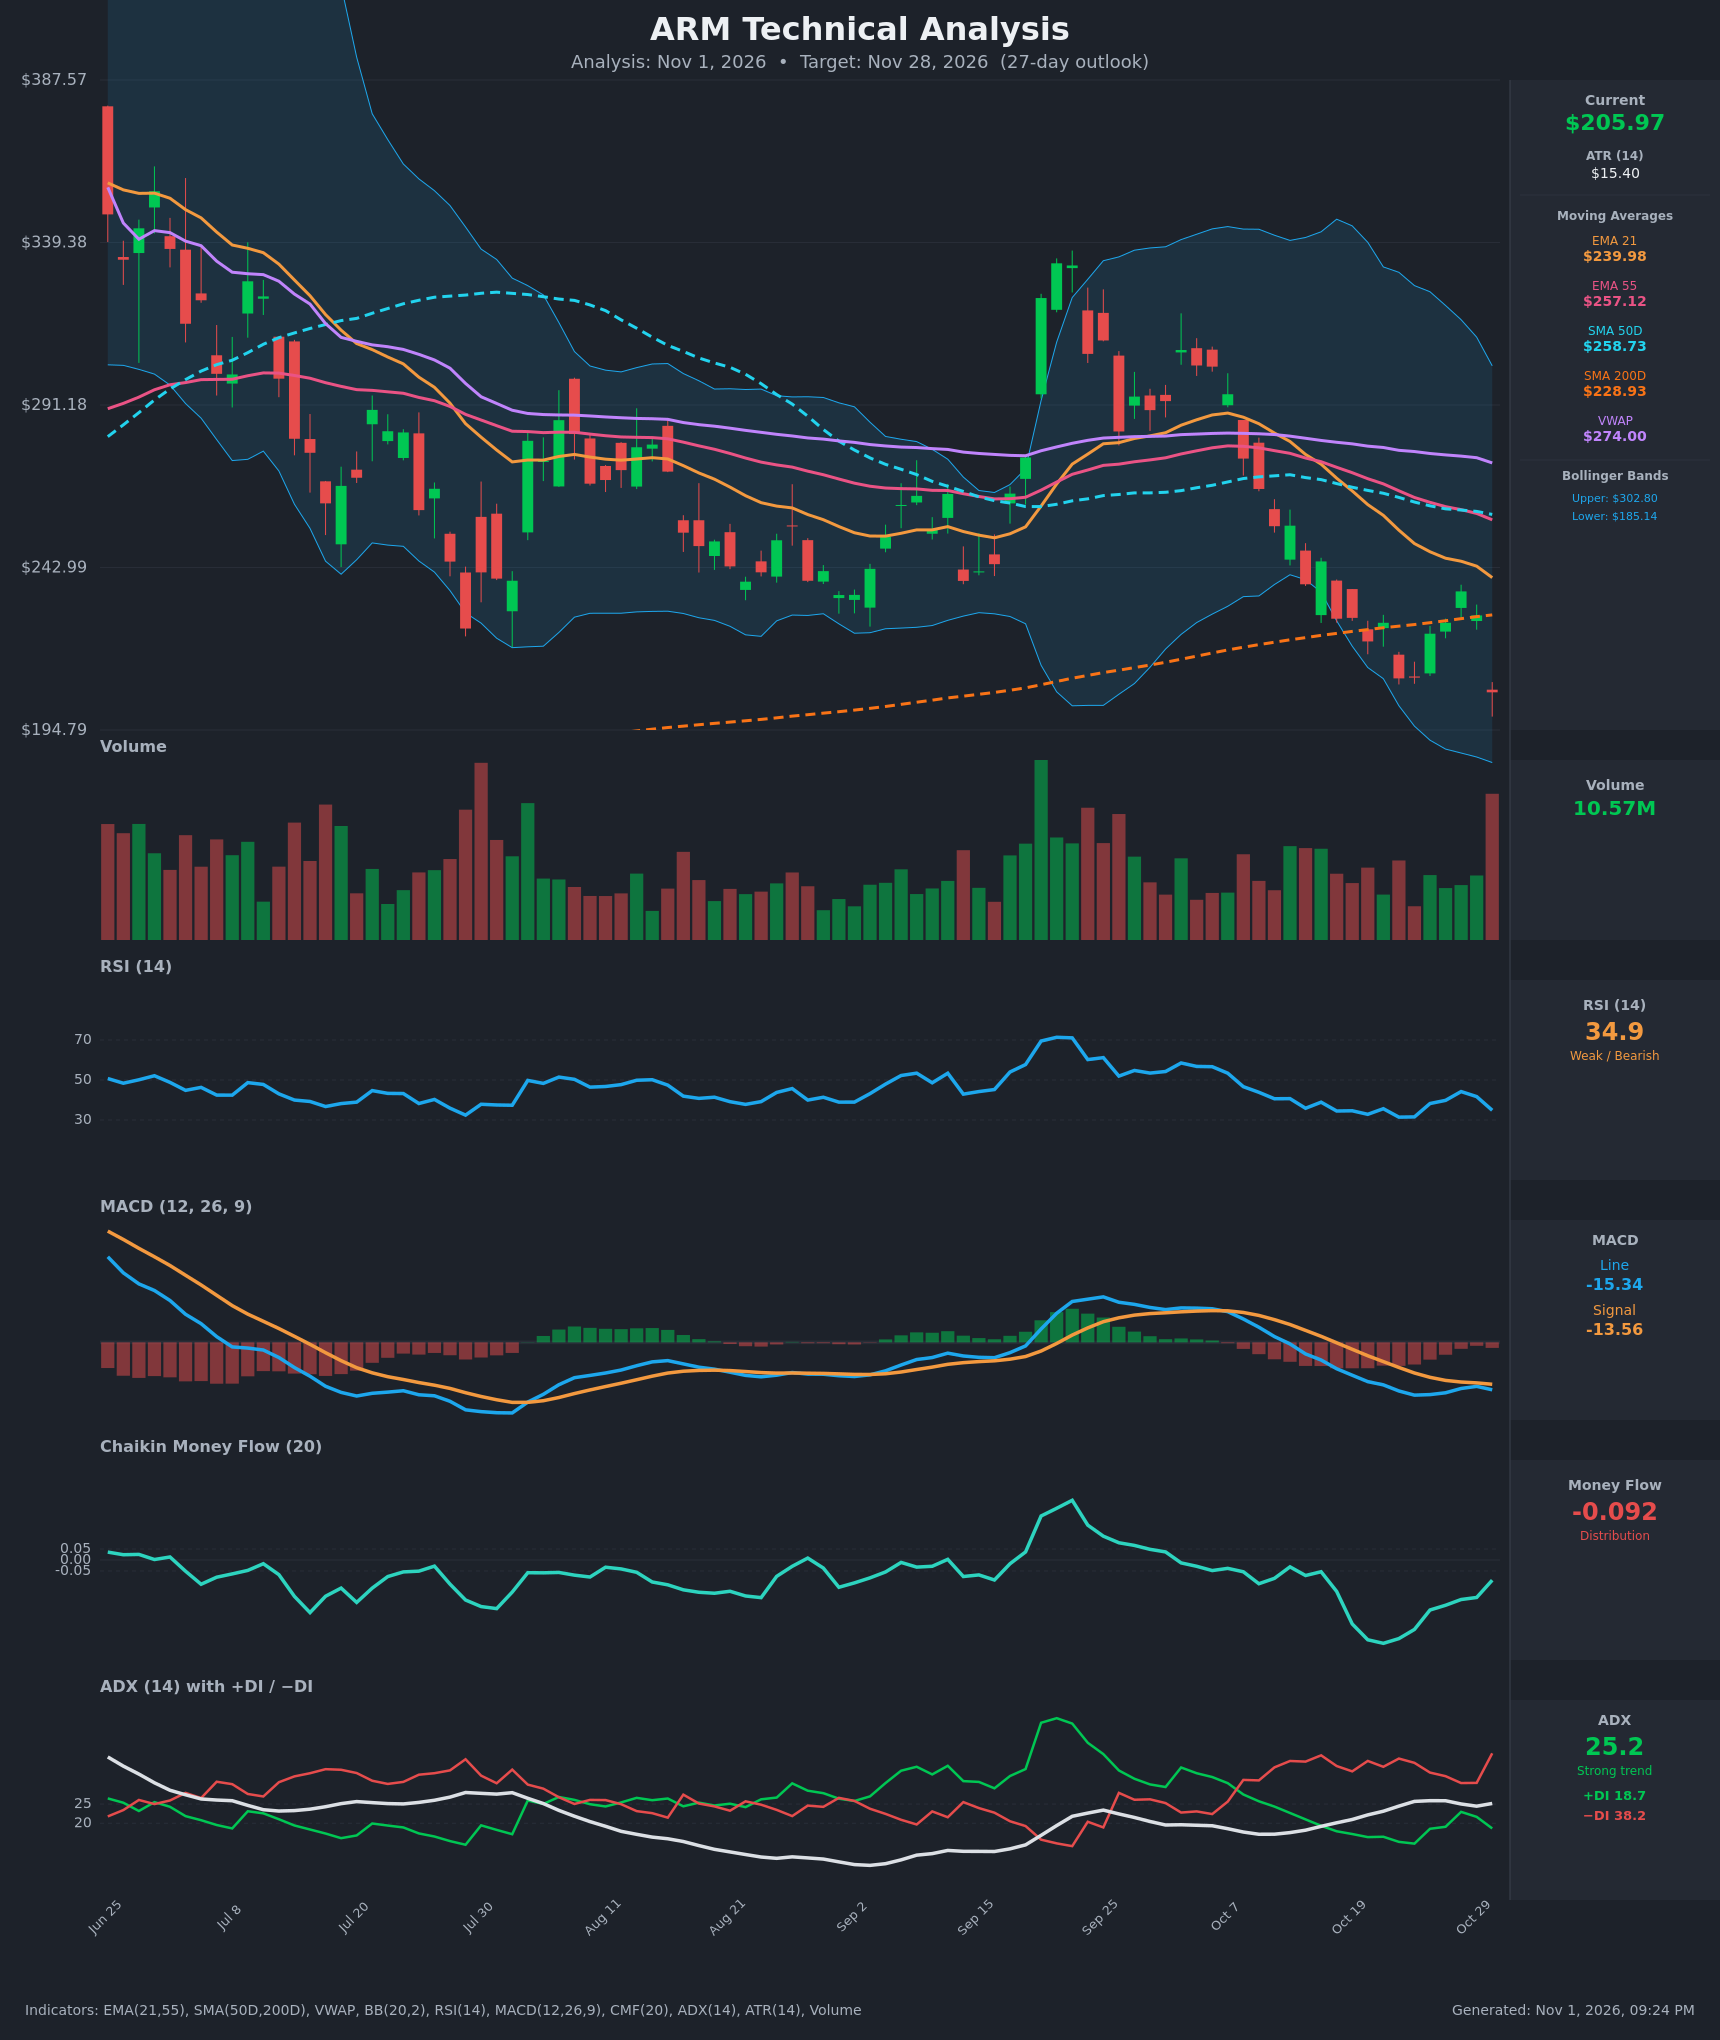
- RSI (14): 34.86, down from 44.2 on Oct 28 and 41.7 on Oct 29. It is near the oversold zone but has not reached <30, and the Oct 22-23 low of ~31 was not breached. Momentum is weak and still falling. [Bearish]
- 20 EMA (EMA 21 = $239.98): Price at $205.97 is about 14% below it. The EMA is falling steadily (from $282.87 on Oct 12) and also sits below the EMA 55 ($257.12), a bearish cross that happened around Oct 15. It is overhead resistance. [Bearish]
- MACD: Line -15.35 is below Signal -13.56, with a histogram of about -1.79. The bearish crossover occurred around Oct 16. The line re-widened its gap below the signal on the latest bar after briefly converging. Momentum is negative and re-accelerating lower. [Bearish]
- Bollinger Bands (20): Upper $302.80, lower $185.14, so the bands are still wide after the September spike. Price sits in the lower third, about $21 above the lower band, and made a large down bar toward it. There is no squeeze. Price is walking the lower half, but a close below the band has not yet occurred. [Bearish]
- CMF (20): -0.092, below the -0.05 threshold, though improved from the -0.379 trough on Oct 21. Selling pressure persists, although it is easing. [Distribution]
- ADX (14): 25.2, right at the strong-trend threshold and rising from 17 on Oct 12. −DI (38.2) is far above +DI (18.7), and the gap widened sharply on the last bar. This is a strong, bearish-controlled trend. [Strong Trend – Bearish]
- Volume: 10.57M on the final bar, the largest volume bar on the chart, on a red candle that fell about 10%. High-volume decline signals aggressive distribution and a breakdown rather than a drift. [Bearish confirmation]
DIVERGENCES & TRENDS
- No bullish divergence: RSI (34.9) is above its Oct 22 low (31.4), but price made a lower low ($205.97 vs $210.10). That is a minor bearish/neutral setup, not a bullish divergence. The latest RSI drop confirms price weakness.
- MA structure: Price is below the EMA 21, EMA 55, SMA 50D ($258.73), and VWAP ($274.00). It has just closed below the SMA 200D ($228.93), which flipped from support to resistance. The EMA 21 < EMA 55 cross is already in place. The SMA 50D is still above the SMA 200D, so there is no death cross yet. The gap is only about $30 and is closing fast, so one is plausible within the 27-day window.
- Rejection: The bounce from $210 to $235.90 (Oct 28) stalled below the declining EMA 21 and the SMA 200D and was sold off, which defines a lower high.
- ADX/DI: −DI has been on top since early October and just spiked back up, while ADX crossed 25.
- CMF: Dropped from positive territory in mid-September to deeply negative, and is only partially recovering. Money flow is not confirming any rally.
CHART PATTERNS
- Descending Triangle (continuation, bearish): Lower highs from the ~$335 September peak down to ~$236, against horizontal support near $210 (Oct 22-23 lows). The latest close at $205.97 on heavy volume breaks that support. The measured move is the triangle height (~$40 from the ~$250 area to $210), giving a theoretical target near $170. This is the full pattern target and is unlikely to be reached in full within 27 days.
- Bearish continuation structure: The decline from the September peak is a series of lower highs and lower lows. The failed retest of the 200D SMA is a classic bearish retest.
- Caution: The lower Bollinger Band at ~$185 and RSI near 30 could trigger oversold bounces. A false breakdown (bear trap) back above $210 would neutralize the pattern.
POTENTIAL SCENARIOS
- Scenario 1: Bearish Triangle Breakdown Continuation — Price confirmed a break below $210 support on heavy volume, with −DI dominant and MACD re-widening. It probes the lower band and grinds lower, with only weak bounces failing at $220-$229. Trigger: sustained closes below $205 / $200. Target: $185 first, then $175-$180 (partial measured move). Invalidation: daily close above $229 (SMA 200D). (55% probability)
- Scenario 2: Bullish Oversold Rebound / Bear Trap — RSI near 30, the lower band, and improving CMF produce a relief rally that reclaims the broken $210 level. Trigger: close back above $215 on rising volume. Target: $228-$240 (SMA 200D and EMA 21). Invalidation: failure at $229 or a new close below $200. (28% probability)
- Scenario 3: Neutral Basing Range — Price stabilizes between the lower band and the broken support after the selloff, consolidating while the moving averages catch down. Trigger: ADX falls below 20 and price holds $190-$215. Target: ~$200-$210. Invalidation: close outside $185-$220. (17% probability)
PRICE TARGETS
- Target Price: $195.00 (27-day horizon)
- Expected Range: $176.00 to $212.00. This is a $36 width, about 17.5% of the current price, in line with the 12-18% guidance for 30-60 days and appropriate for a 27-day horizon given an ATR of $15.40.
- Key Levels: Support at $185.14 (lower Bollinger Band), Resistance at $228.93 (SMA 200D)
OVERALL BIAS
OVERALL BIAS: BEARISH - Price broke below the $210 support of a descending triangle on the heaviest volume of the period, closed below the 200D SMA, and sits under every moving average. −DI (38.2) dominates +DI (18.7) with ADX at 25.2, MACD is below its signal, and CMF shows distribution. RSI near 35 and the lower band at ~$185 leave room for a bounce, but the evidence favors continued downside.
This is educational analysis and not financial advice.