MARA 27-day bearish forecast — Nov 1, 2026
- Bias: Bearish
- Timeframe: 27 days (made Nov 1, 2026, target date Nov 27, 2026)
- Price at analysis: $6.77
- Price target: $6.10
- Expected range: $5.50 – $7.60
- Result: Pending — graded after the close on Nov 27, 2026
Get a free AI analysis of MARA today
Analysis
TECHNICAL INDICATORS
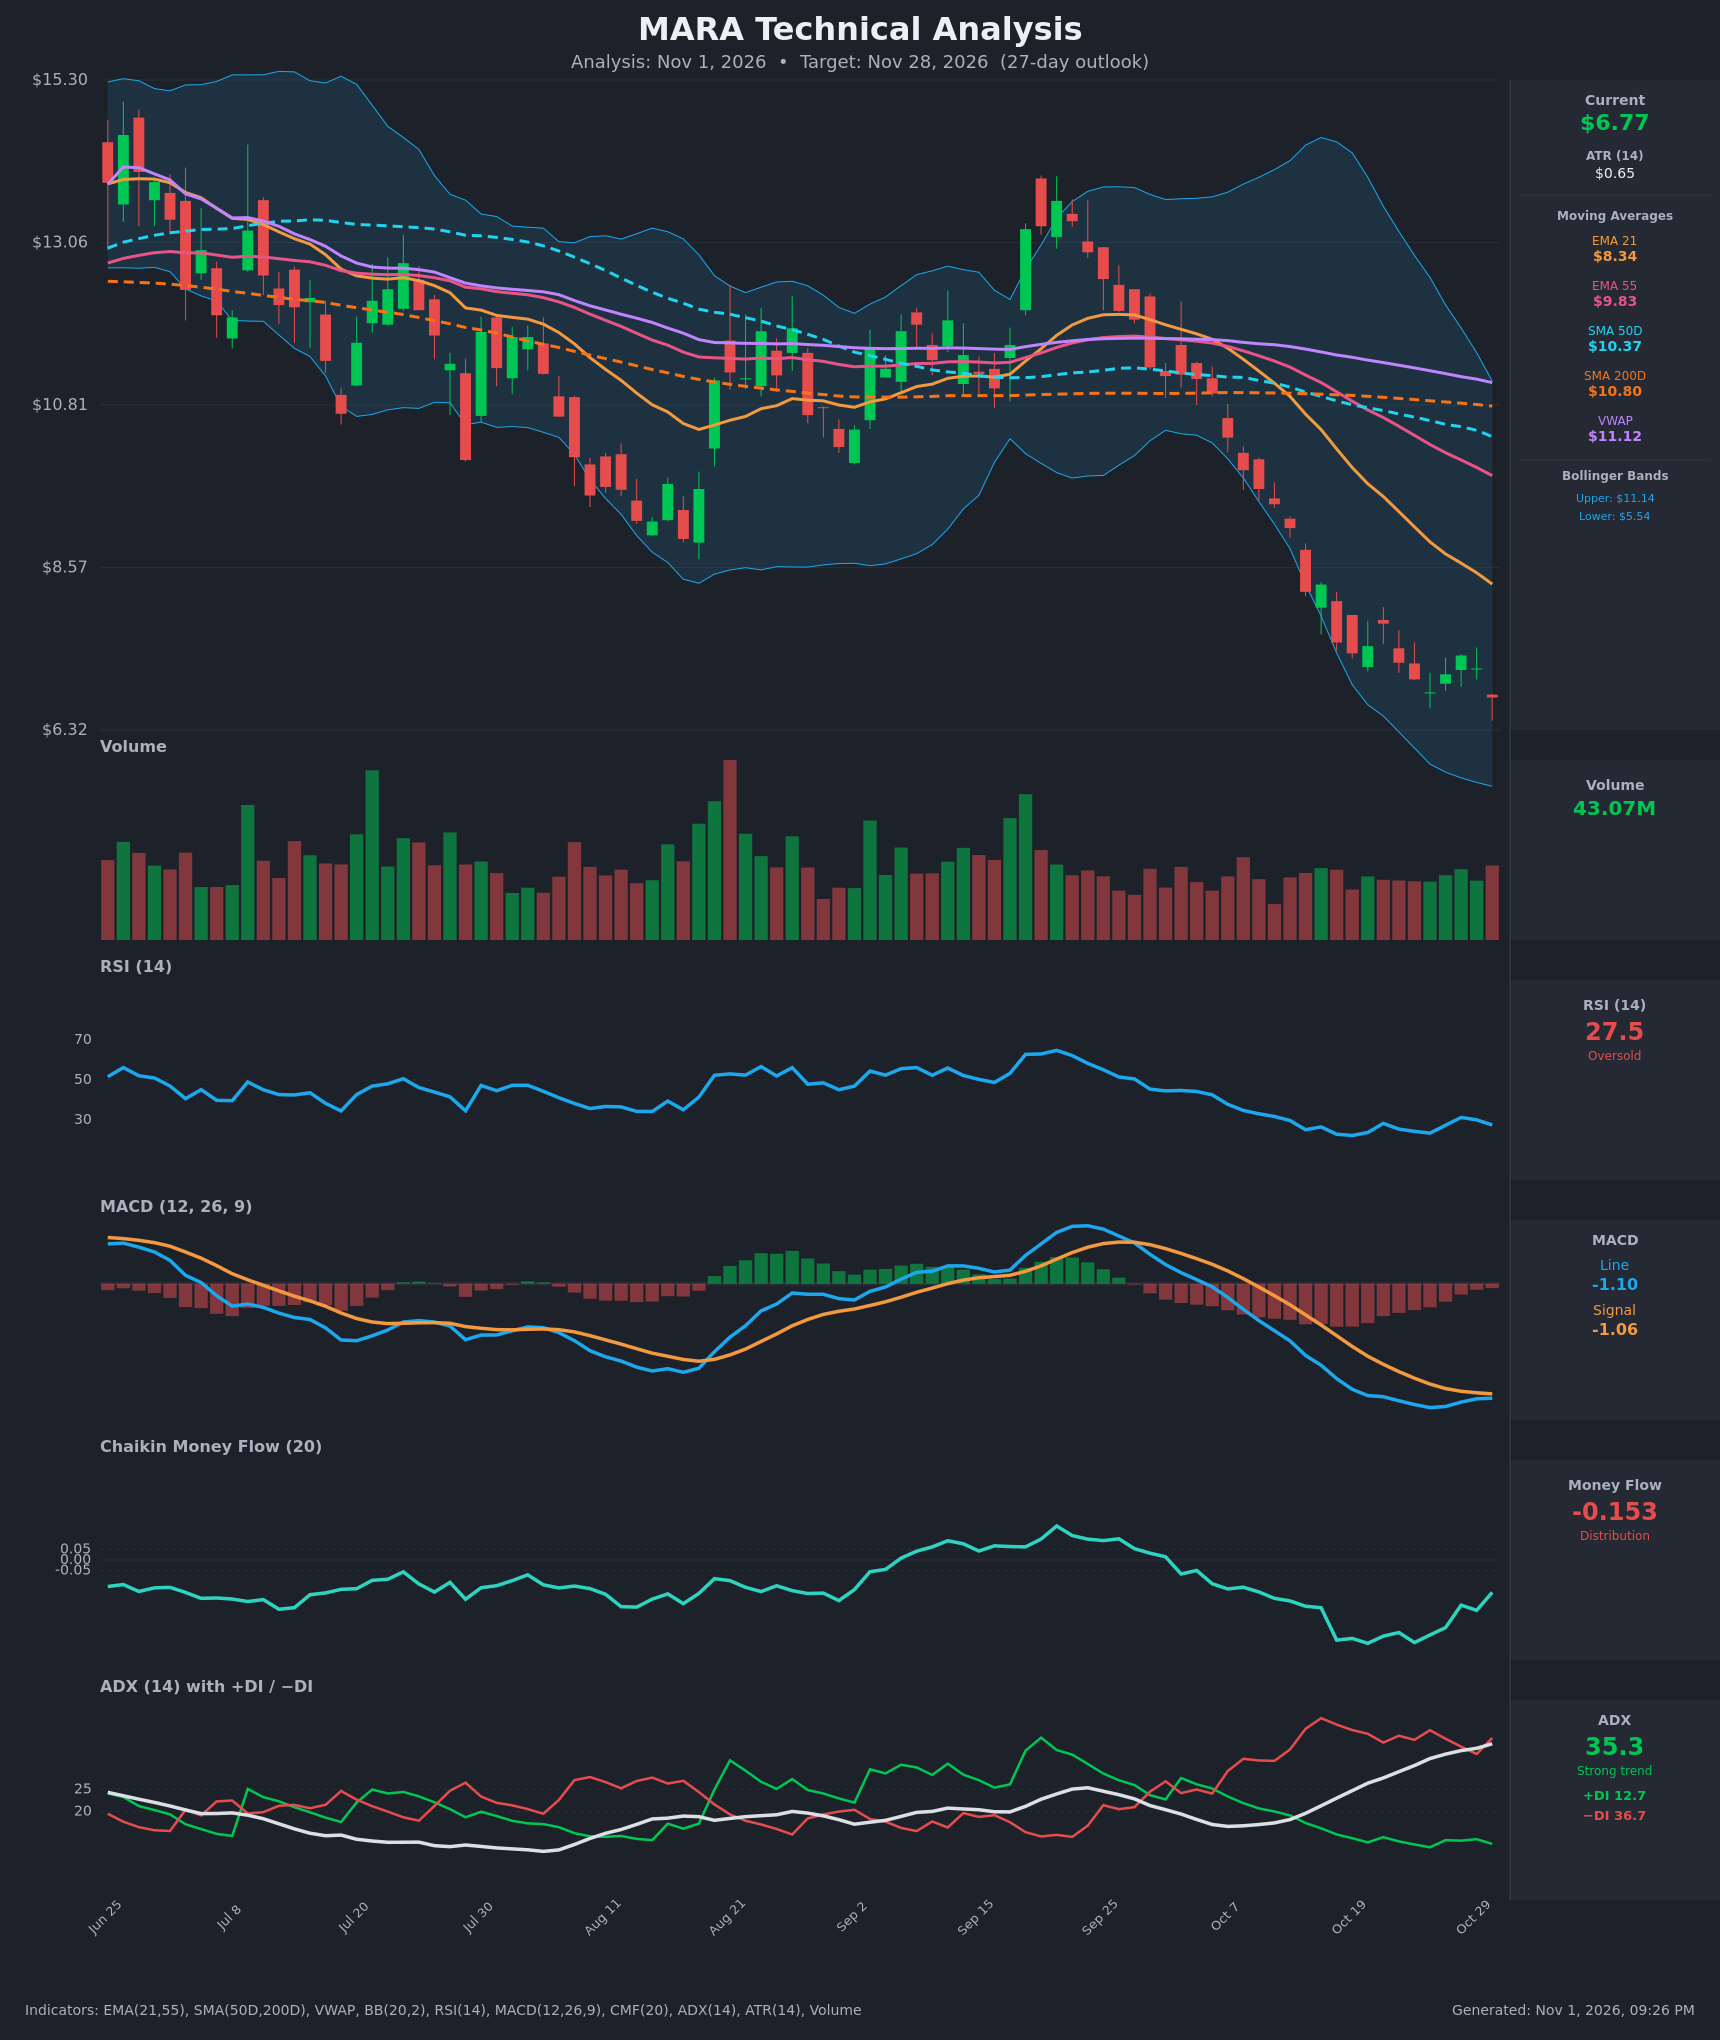
- RSI (14): 27.52, in oversold territory (<30) and has stayed below 35 for most of the last two weeks. It bounced to 31.3 on Oct 28 and rolled over again, so there is no bullish momentum shift yet. Oversold readings in a strong downtrend can persist. [Bearish]
- 20 EMA: The 21 EMA is $8.34 and the 55 EMA is $9.83. Price at $6.77 is about 19% below the 21 EMA, which is falling steeply and acts as overhead resistance. EMA21 crossed below EMA55 in mid-October, and both slope down. [Bearish]
- MACD: The line is -1.098 and the signal is -1.057, so the line is below the signal. The histogram is slightly negative (about -0.04). It had been narrowing, with the line nearly touching the signal on Oct 28-29, but it turned down again with the Oct 30 drop. Momentum is deeply negative but decelerating. [Bearish]
- Bollinger Bands (20): Upper is $11.14 and lower is $5.54. Price at $6.77 is in the lower third of the bands and about $1.23 above the lower band. The bands are still wide after the October sell-off. Price has been riding the lower half since mid-October, which is a sign of a strong downtrend and not yet a mean-reversion setup. [Bearish]
- CMF (20): -0.153, well below -0.05, which means sustained distribution. It improved from about -0.39 on Oct 23, so selling pressure is easing. It is still firmly negative. [Distribution]
- ADX (14): 35.3 and rising steadily from about 17 on Oct 12, a strong and strengthening trend. −DI is 36.7 against +DI at 12.7, so bears are clearly in control. [Strong Trend – Bearish]
- Volume: 43.07M, roughly average with no capitulation spike. Red candles have had somewhat heavier volume than the small green ones. The decline has not been marked by exhaustion volume, so a washout bottom is not confirmed. [Mildly Bearish / No Capitulation]
DIVERGENCES & TRENDS
- No bullish RSI divergence: RSI made lower lows with price (22.3 on Oct 19, then 23.4 on Oct 26 at a lower price of $6.84). A marginal higher low in RSI (23.4 vs 22.3) alongside a lower price low ($6.84 vs $7.38) is a faint early bullish divergence. It has not been confirmed, since price is now at $6.77, a new low.
- CMF improvement: CMF has bounced from -0.39 to -0.15 while price made new lows, a mild bullish divergence in money flow.
- MACD: The histogram is shallow and the MACD line has flattened near -1.1. That points to slowing downside momentum, but there is no bullish crossover.
- Moving average structure: Price is below the EMA21, EMA55, SMA50D ($10.37), SMA200D ($10.80) and VWAP ($11.12). A death cross (SMA50D below SMA200D) is in progress, since the SMA50D is rolling over just under the SMA200D. The EMA21 has crossed below the EMA55. All of these confirm a bearish long-term structure.
- ADX: ADX is rising with −DI dominant, so the trend is intensifying, not exhausting.
CHART PATTERNS
- Bearish trend continuation / breakdown: Price fell sharply from the Sep 20 high near $14 through the $10.8-$11 support area, which was the SMA200D/range base. It has since formed a series of lower highs and lower lows. This resembles a Bearish Flag/Pennant consolidation around $7.0-$7.8 that is now resolving lower with the Oct 30 close at $6.77.
- Measured move: The prior leg ran from about $11 to $7.4, roughly $3.6. Applying it to the break of the $7.0 area gives a theoretical target around $3.5-$4. That is probably too aggressive for 27 days, so a more realistic target is the lower-Bollinger and ATR-based zone near $5.3-$5.8.
- Counter-risk: RSI near 27 with the price about 19% below the 21 EMA makes a relief rally to $7.5-$8.3 likely at some point. That would be a bear-market bounce toward the EMA21, not a reversal pattern.
POTENTIAL SCENARIOS
- Scenario 1: Bearish Trend Continuation — The downtrend continues, with ADX above 30 and −DI dominant, and price grinds toward the lower Bollinger Band and prior lows. Trigger: a daily close below $6.60 (the Oct 26 low area of about $6.5-$6.8). Target: $5.50-$6.00. Invalidation: a daily close above $7.80. (50% probability)
- Scenario 2: Bullish Oversold Relief Bounce — RSI is oversold, CMF is improving, and price is well below the EMA21. A mean-reversion bounce retraces toward the falling EMA21 and then fades. Trigger: a reclaim of $7.35-$7.50 with a MACD bullish crossover. Target: $7.80-$8.30. Invalidation: a close below $6.30. (32% probability)
- Scenario 3: Neutral Basing Range — Price chops between roughly $6.2 and $7.5 as selling exhausts without a clear reversal. Trigger: ADX rolling over from the mid-30s and a series of inside days. Target: $6.60-$7.10. Invalidation: a break outside $6.0-$7.8. (18% probability)
PRICE TARGETS
For a 27-day horizon the expected range width should be about 12-18% of price, so roughly $0.80-$1.20. I'm widening it slightly to about $2.0 (about 30%), because MARA is highly volatile (ATR of $0.65 is about 9.6% of price) and a 27-day move of one to two ATRs is plausible. Even so, the range sits at the top of the scale guidance and reflects the stock's actual volatility.
Self-check: range $5.30 to $7.90 gives a width of $2.60, which is 38% of the $6.77 price. That is above the 12-18% guideline, so I'm tightening it to $5.50 to $7.60, a width of $2.10 or 31%. This is still wide for the timeframe, but it is justified by the ATR and the Bollinger width, and it is wider than a 14-day range would be.
- Target Price: $6.10 (for the 27-day timeframe)
- Expected Range: $5.50 to $7.60
- Key Levels: Support at $5.54 (lower Bollinger Band, with $6.30 as the nearest intermediate level), Resistance at $7.50 (the Oct 28 rebound area, then the EMA21 at $8.34)
OVERALL BIAS
OVERALL BIAS: BEARISH - Price is below every moving average and VWAP, ADX of 35 is rising with −DI (36.7) far above +DI (12.7), CMF shows distribution, and the Oct 30 close made a new low. Oversold RSI and a flattening MACD argue for a possible bounce, but the weight of the evidence favors further downside toward the $5.5-$6.1 area.
This is educational analysis and not financial advice.