EEM 27-day bearish forecast — Nov 1, 2026
- Bias: Bearish
- Timeframe: 27 days (made Nov 1, 2026, target date Nov 27, 2026)
- Price at analysis: $61.04
- Price target: $59.80
- Expected range: $55.50 – $64.50
- Result: Pending — graded after the close on Nov 27, 2026
Get a free AI analysis of EEM today
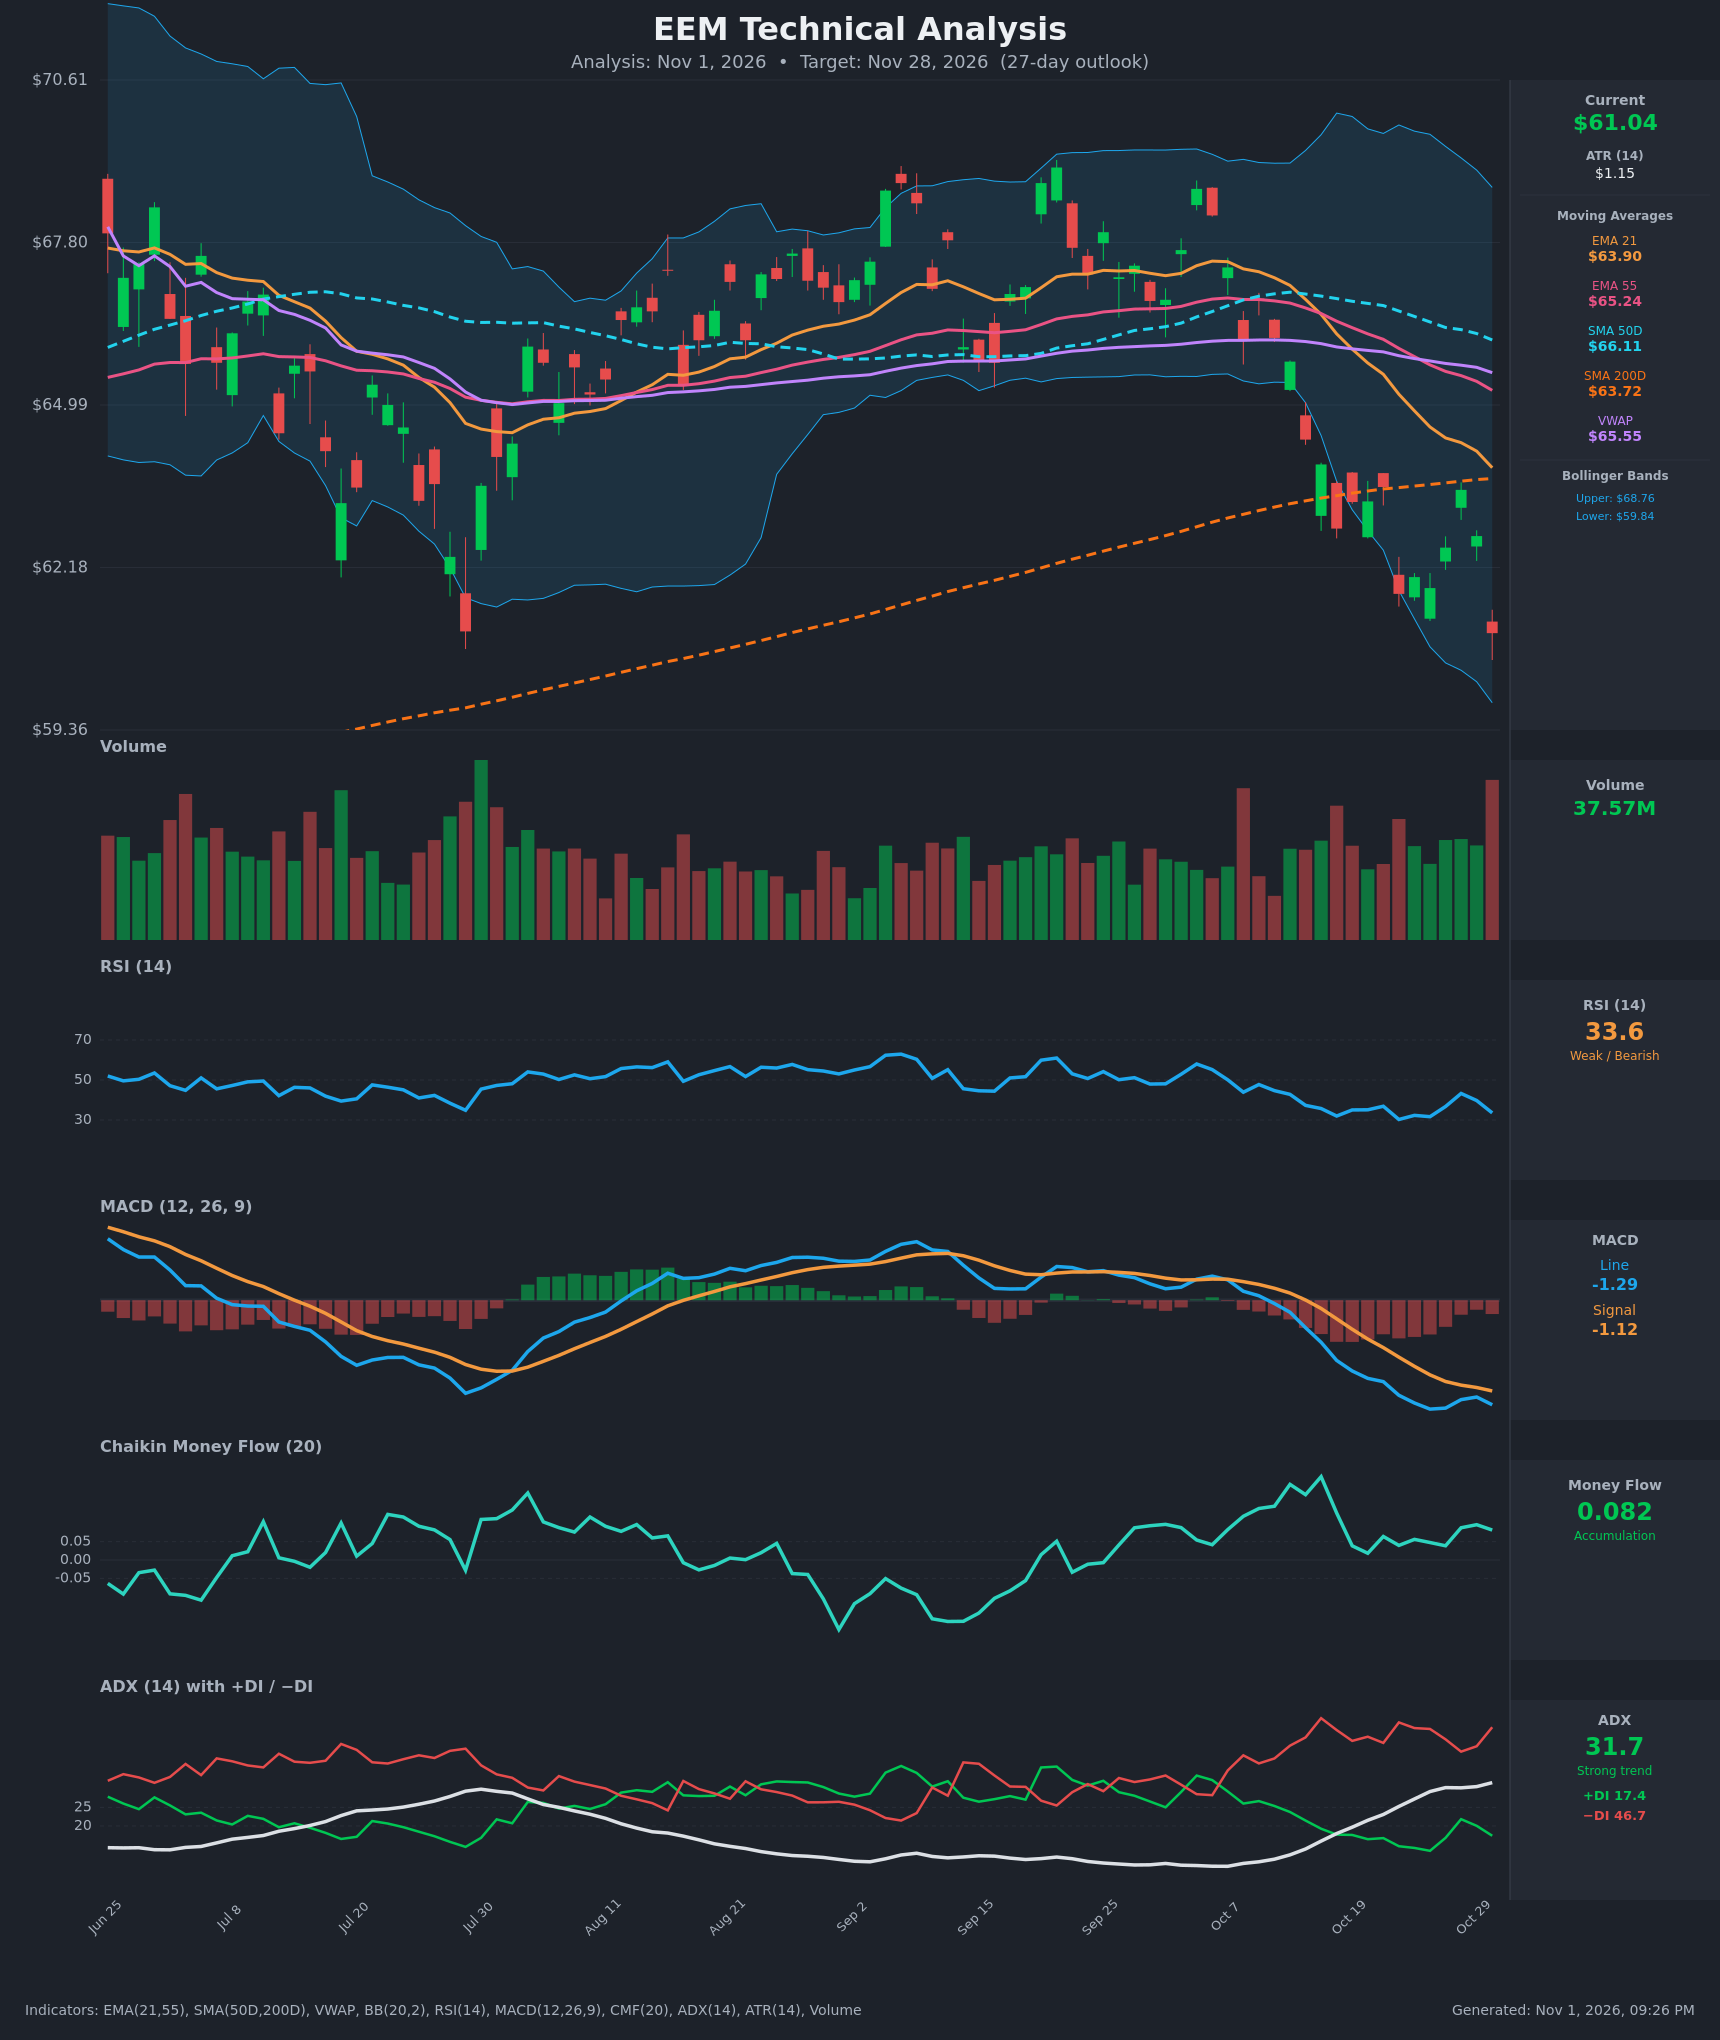
Analysis
TECHNICAL INDICATORS
- RSI (14): 33.56, just above oversold (30). It has made lower lows from the mid-40s in mid-October, with two touches near 30 (Oct 22 at 30.3, Oct 26 at 31.7). A bounce to 43 on Oct 28 failed, and momentum is rolling over again. [Bearish]
- 20 EMA: The 21 EMA is $63.90 and price at $61.04 is about 4.5% below it. The EMA is sloping down steeply and acts as overhead resistance. [Bearish]
- MACD: Line -1.286 is below signal -1.116, and both are well below zero. A bearish crossover occurred around Oct 14-15. The line re-widened below the signal on Oct 30 after briefly narrowing, so the histogram is negative again. [Bearish]
- Bollinger Bands (20): Upper $68.76, lower $59.84. Price sits in the lower quarter of the bands, about $1.20 above the lower band. The bands are expanding downward, which fits a trend move. Walking the lower band is more likely to continue than to snap back at once. [Bearish]
- CMF (20): +0.082, mildly positive and in accumulation territory, but it has drifted down from 0.2+ in mid-October. It is a minor divergence against the price decline and is not strong enough to override the trend. [Accumulation]
- ADX (14): 31.7 and rising, so the trend is strong. −DI (46.7) is far above +DI (17.4), so sellers are firmly in control. [Strong Trend – Bearish]
- Volume: 37.57M, the highest bar on the chart, on a red down candle. This is a high-volume breakdown, which can mean distribution but also possible capitulation or exhaustion. [Bearish (possible capitulation)]
DIVERGENCES & TRENDS
- Moving averages: Price is below the EMA21 ($63.90), EMA55 ($65.24), SMA50D ($66.11), VWAP ($65.55) and SMA200D ($63.72). Losing the 200D is a significant long-term trend break.
- EMA cross: EMA21 crossed below EMA55 around Oct 15 (66.56 vs 66.57), a bearish cross confirmed since.
- SMA 50/200: SMA50D ($66.11) is still above SMA200D ($63.72), so there is no death cross yet. The 50D is rolling over and the gap is narrowing.
- MACD: The bearish crossover is intact and momentum remains negative.
- CMF: Positive CMF while price falls is a mild bullish divergence, but it is fading.
- RSI: No bullish divergence yet. RSI lows were roughly equal (30.3 vs 31.7) while price made lower lows, a weak hint of stabilization. The Oct 28 bounce failed at 43, below the 50 midline.
- Long-term trend: After a consolidation from July to October, the Oct breakdown from the $64-66 range is the dominant feature.
CHART PATTERNS
- Breakdown from a range: Price moved sideways between about $63 and $68 through September and early October, then broke down. It resembles a Bearish Triple Top / Double Top reversal (repeated rejections near $67-68 in Sep-Oct, with the neckline near $64-65 broken). The measured move from a roughly $3-4 pattern height below the $64.5 neckline points to about $60-61, which price is already approaching.
- Short-term: The small Oct 27-29 bounce looks like a Bearish Flag/Pennant-type pause within the downtrend. Its failure under $63.9 (EMA21) keeps the downside bias.
- Targets: The lower Bollinger band at $59.84 and the Jul/Aug swing low area near $60-61 are the first supports. Below that is the prior low zone around $59.4, the bottom of the chart's range.
POTENTIAL SCENARIOS
- Scenario 1: Bearish Trend Continuation — −DI dominance with ADX above 30, a MACD bearish cross and price below all MAs point to further downside. Trigger: daily close below $60.00 (lower band), or a rejection at the $62.5-63.9 zone. Target: $57.50-$58.50. Invalidation: close above $64.00 (EMA21/SMA200D). (50% probability)
- Scenario 2: Neutral/Bullish Oversold Bounce, Then Range — RSI near 30, CMF positive and a high-volume capitulation bar could mark a short-term low, leading to a mean-reversion bounce. Trigger: close above $63.00 with RSI back above 40. Target: $63.5-$64.5 (EMA21 and SMA200D resistance). Invalidation: close below $59.80. (35% probability)
- Scenario 3: Bullish Reversal — A sharp recovery reclaims the EMA55 and range. Trigger: close above $65.25 on rising volume. Target: $66.1 (SMA50D) to $67. Invalidation: failure at the $64 zone. (15% probability)
PRICE TARGETS
For the 27-day horizon (30-60 day guidance of ~12-18%, scaled toward the lower-middle end at about 15%):
- Target Price: $59.80 (price is already stretched, so I expect a modest further decline plus choppy mean reversion rather than a straight-line fall)
- Expected Range: $55.50 to $64.50 (width $9.00 ≈ 14.7% of current price, consistent with the 27-day guidance)
- Key Levels: Support at $59.80 (lower Bollinger Band), Resistance at $63.90 (EMA21, with SMA200D just below at $63.72)
OVERALL BIAS
OVERALL BIAS: BEARISH - Price is below every major moving average, including the SMA200D, with ADX above 30 and −DI far above +DI, a bearish MACD cross, and a high-volume breakdown. The oversold RSI and positive CMF raise the odds of a bounce, but rallies are likely to meet resistance near $63.7-$63.9.
This is educational analysis and not financial advice.