GLD 27-day bearish forecast — Nov 1, 2026
- Bias: Bearish
- Timeframe: 27 days (made Nov 1, 2026, target date Nov 27, 2026)
- Price at analysis: $355.78
- Price target: $349.00
- Expected range: $328.00 – $373.00
- Result: Pending — graded after the close on Nov 27, 2026
Get a free AI analysis of GLD today
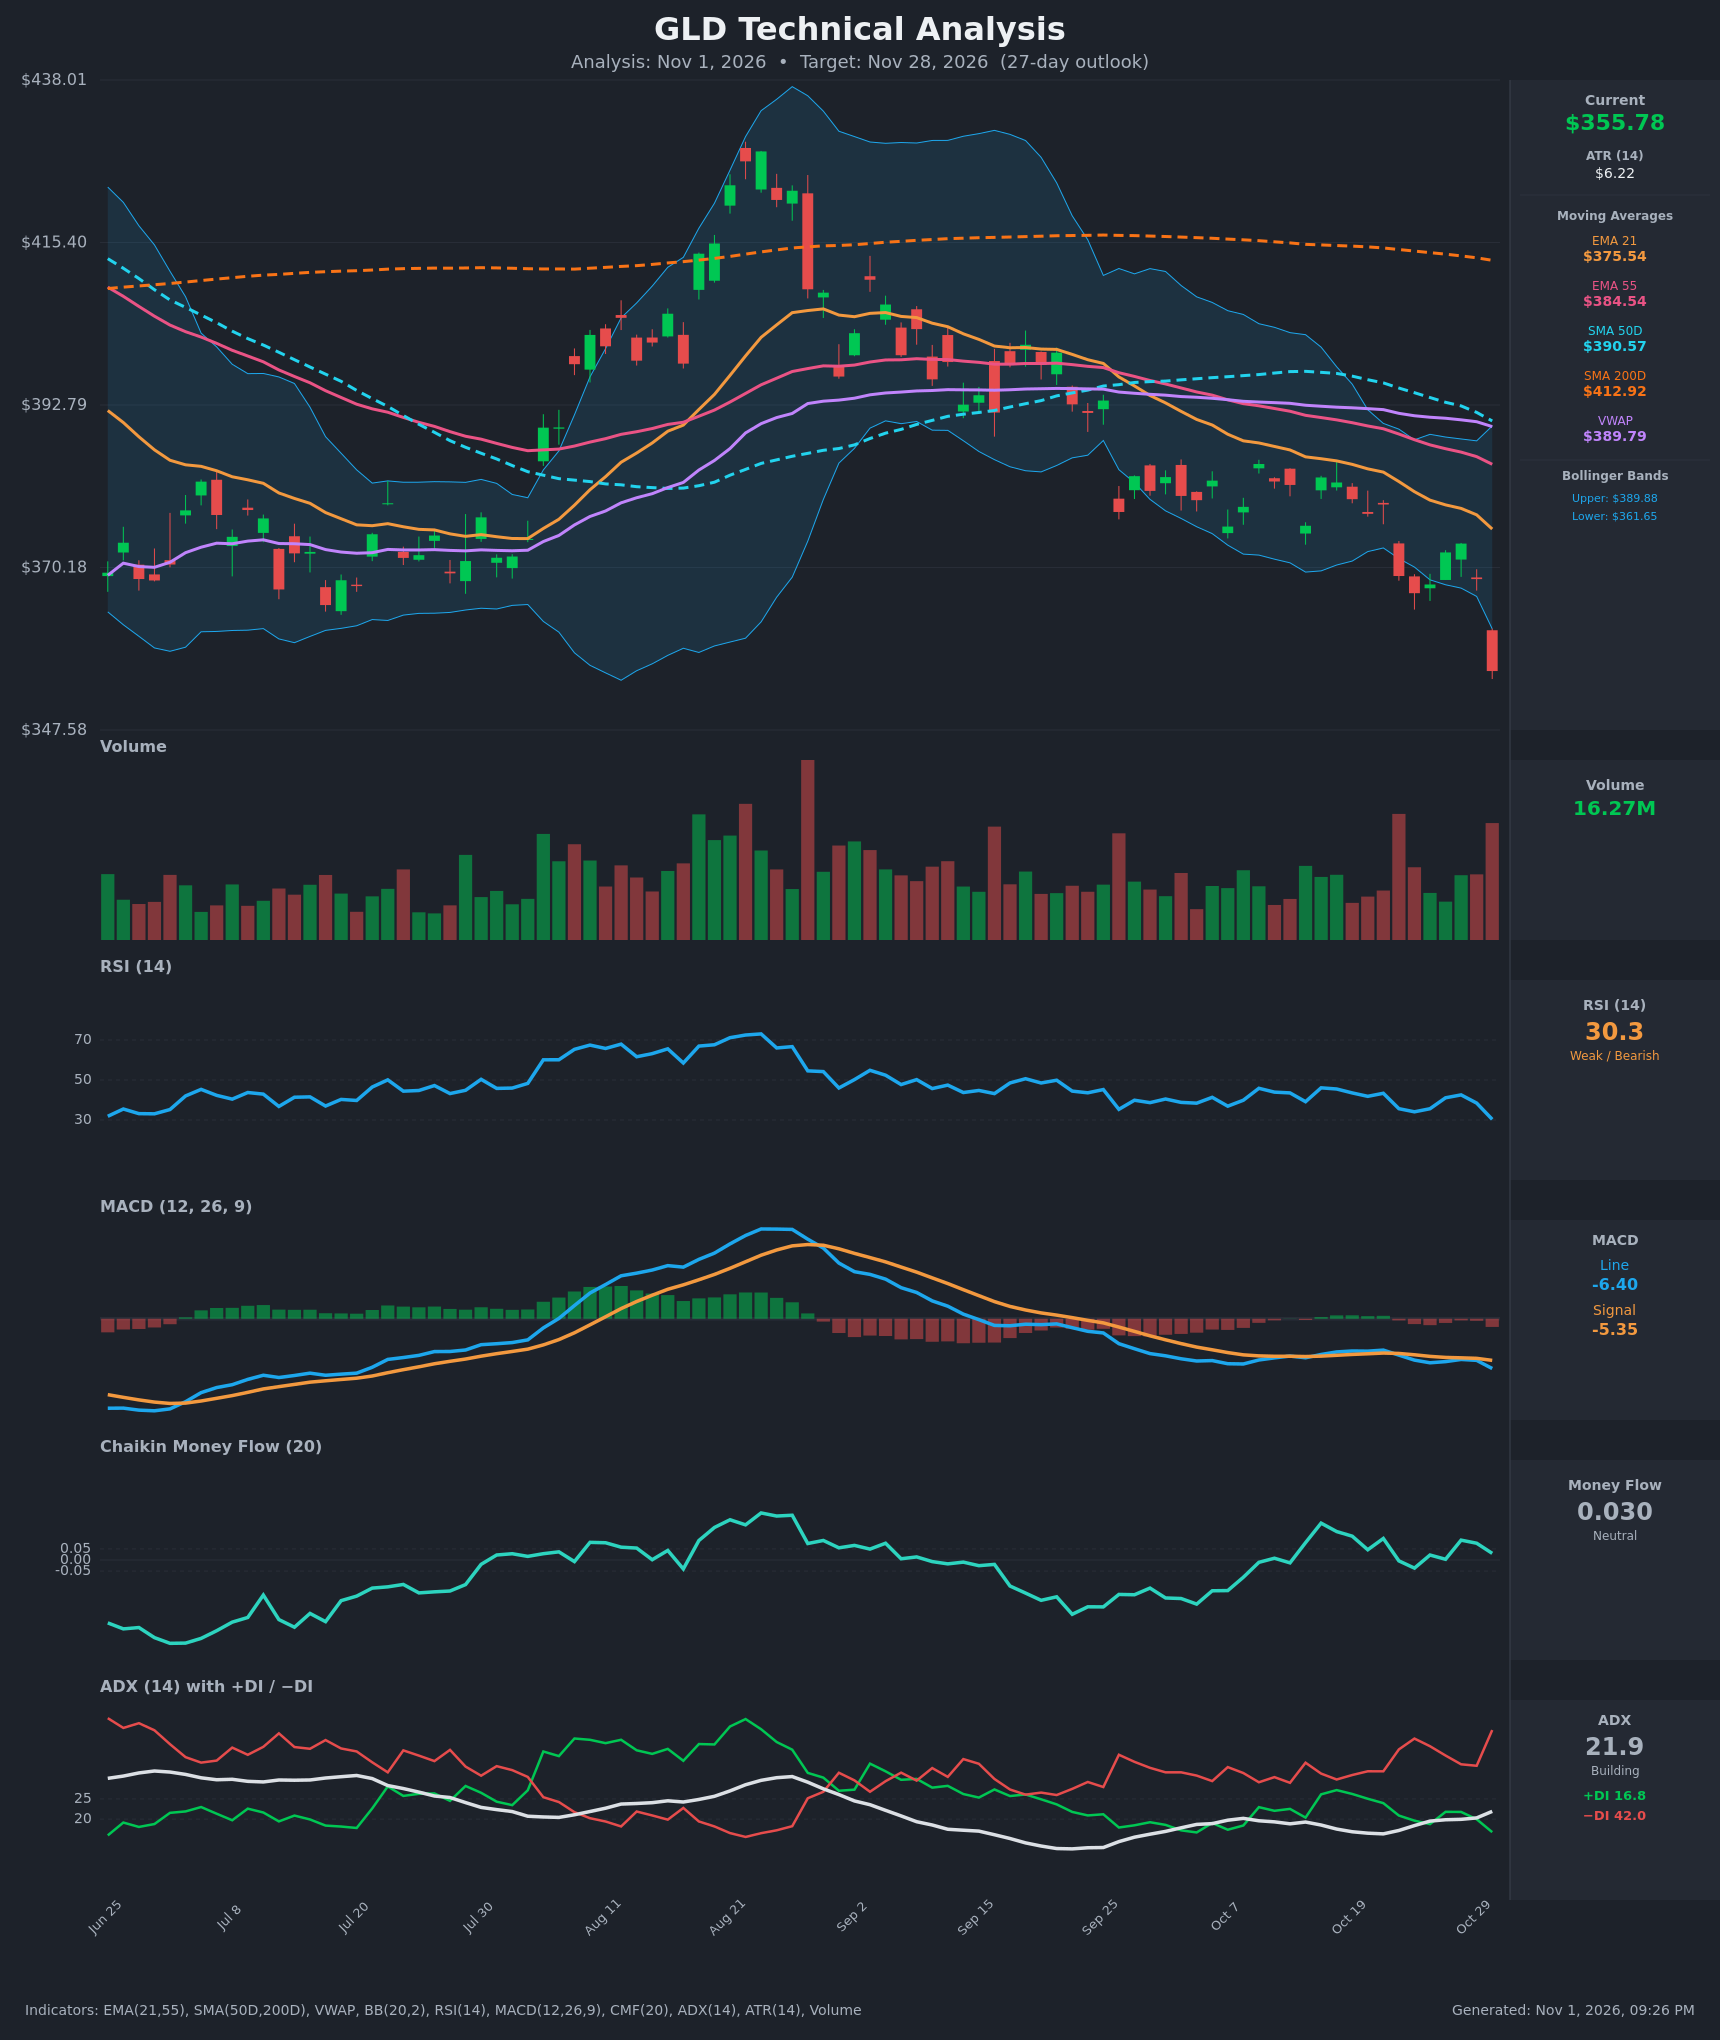
Analysis
TECHNICAL INDICATORS
- RSI (14): 30.3, down from 38.5 the day before and 42.6 on Oct 28. It sits right at the oversold threshold with momentum still falling, and there is no bullish divergence yet. Oversold readings can persist in a downtrend. [Bearish]
- 20 EMA: The EMA 21 is $375.54 and price ($355.78) is about 5.3% below it. The EMA 21 is below the EMA 55 ($384.54), and the gap is widening. The EMA 21 is now overhead resistance. [Bearish]
- MACD: The line is -6.40, below the signal at -5.35, and the histogram is about -1.05 and expanding. The bearish crossover happened around Oct 22, and the line has made a new low since. [Bearish]
- Bollinger Bands (20): The upper band is $389.88, the lower band is $361.65 and the midline is about $375.8. Price closed about $5.9 below the lower band after a large red candle. This is a band-walk breakdown, which signals strong downside momentum but also a stretched, oversold position. [Bearish]
- CMF (20): 0.030, inside the neutral band (-0.05 to +0.05). It has hovered near zero and slightly positive through the decline, so there is no heavy distribution but also no accumulation to support a rebound. [Neutral]
- ADX (14): 21.9 and rising from 16.4. −DI is 42.0 versus +DI 16.8, a 25-point spread. The trend is about to cross into strong-trend territory (>25), with bears clearly in control. [Building Trend – Bearish]
- Volume: 16.27M on the latest bar, one of the heavier recent bars, and it came on a sharp down day. Heavy volume on a breakdown shows real selling rather than a drift lower, though it can also mark capitulation. [Bearish confirmation / possible exhaustion]
Other trend context:
- Price is below the SMA50D ($390.57), the SMA200D ($412.92) and VWAP ($389.79).
- The SMA50D is below the SMA200D, so a death cross is already in place.
DIVERGENCES & TRENDS
- No bullish divergence: RSI at 30.3 is making a new low alongside price, so momentum and price agree. The prior Oct 23 low (RSI 34.1) was undercut, which is confirmation rather than divergence.
- Bearish MACD crossover and expansion: The Oct 22 crossover has since extended, and the histogram is widening negative.
- Full bearish MA stack: Price < EMA21 < EMA55 < SMA50D < SMA200D, with VWAP also overhead. All averages are sloping down, so every rally has to clear several layers of resistance.
- DI dominance: −DI has led since mid-October and just jumped from 33 to 42, while ADX turns up. That is a trend-strengthening signature on the downside.
- Counterweight: RSI is at 30 and price is outside the lower Bollinger Band, so a short-term relief bounce is likely. Neutral CMF means selling pressure is not extreme.
- Larger structure: The August peak (~$430) was followed by a series of lower highs and a break of the Sep–Oct range.
CHART PATTERNS
- Bearish rectangle / flag breakdown (closest match: Bearish Flag, Bearish Triple Top): From late September to late October, price chopped sideways in roughly a $366–$385 range, and the latest candle broke below the bottom of that range. The range is about $20 tall. A measured move from the ~$366–$368 breakdown level projects to roughly $346–$349.
- Larger topping structure (loosely a Head and Shoulders / rounded top): The August spike to ~$430 is the head, with weaker rallies after it. That supports the case that the primary trend has turned down.
- Reversal caveat: Price is stretched below the Bollinger lower band with RSI at 30, so a bounce back toward the $368–$376 zone (broken support / EMA 21) is possible before any continuation.
POTENTIAL SCENARIOS
- Scenario 1: Bearish Breakdown Continuation — The range breakdown extends with a possible bounce to retest broken support, then lower. −DI dominance and an ADX move above 25 favor trend continuation. Trigger: failure to reclaim $368–$369 on a bounce, or a daily close below $350. Target: $346–$350 on the measured move, with an extension toward $335 if selling accelerates. Invalidation: daily close above $376 (EMA 21). (50% probability)
- Scenario 2: Bullish Oversold Relief Rally — RSI at 30 and the close below the lower band trigger mean reversion toward the middle band and EMA 21, then stall under the EMA 55. Trigger: bullish RSI divergence or a reclaim of $368 with expanding volume. Target: $375–$380 (EMA 21 / Bollinger midline). Invalidation: close below $345. (35% probability)
- Scenario 3: Neutral Basing Range — Price stabilizes after the flush and chops between support and the broken range low. Trigger: tight candles on declining volume and a flat MACD histogram. Target: $350–$365. Invalidation: close outside $345–$369. (15% probability)
PRICE TARGETS
- Target Price: $349.00 (27-day horizon, a modest further decline from $355.78 toward the measured-move area, allowing for an interim relief bounce)
- Expected Range: $328.00 to $373.00. The width is $45, or about 12.6% of current price, which fits a ~27-day window, comfortably wider than a 2–3 day range and in line with ATR-scaled volatility.
- Key Levels: Support at $345.00, Resistance at $369.00
OVERALL BIAS
OVERALL BIAS: BEARISH - Price has broken below its multi-week range and the lower Bollinger Band. It sits under a fully bearish MA stack with a death cross in place, MACD is below its signal with an expanding negative histogram, and −DI (42.0) dominates +DI (16.8) while ADX is rising. Oversold RSI (30.3) argues for a bounce along the way, but the evidence favors continuation toward the ~$349 measured-move area.
This is educational analysis and not financial advice.