IREN 27-day bearish forecast — Nov 1, 2026
- Bias: Bearish
- Timeframe: 27 days (made Nov 1, 2026, target date Nov 27, 2026)
- Price at analysis: $23.95
- Price target: $22.00
- Expected range: $20.25 – $24.50
- Result: Pending — graded after the close on Nov 27, 2026
Get a free AI analysis of IREN today
Analysis
TECHNICAL INDICATORS
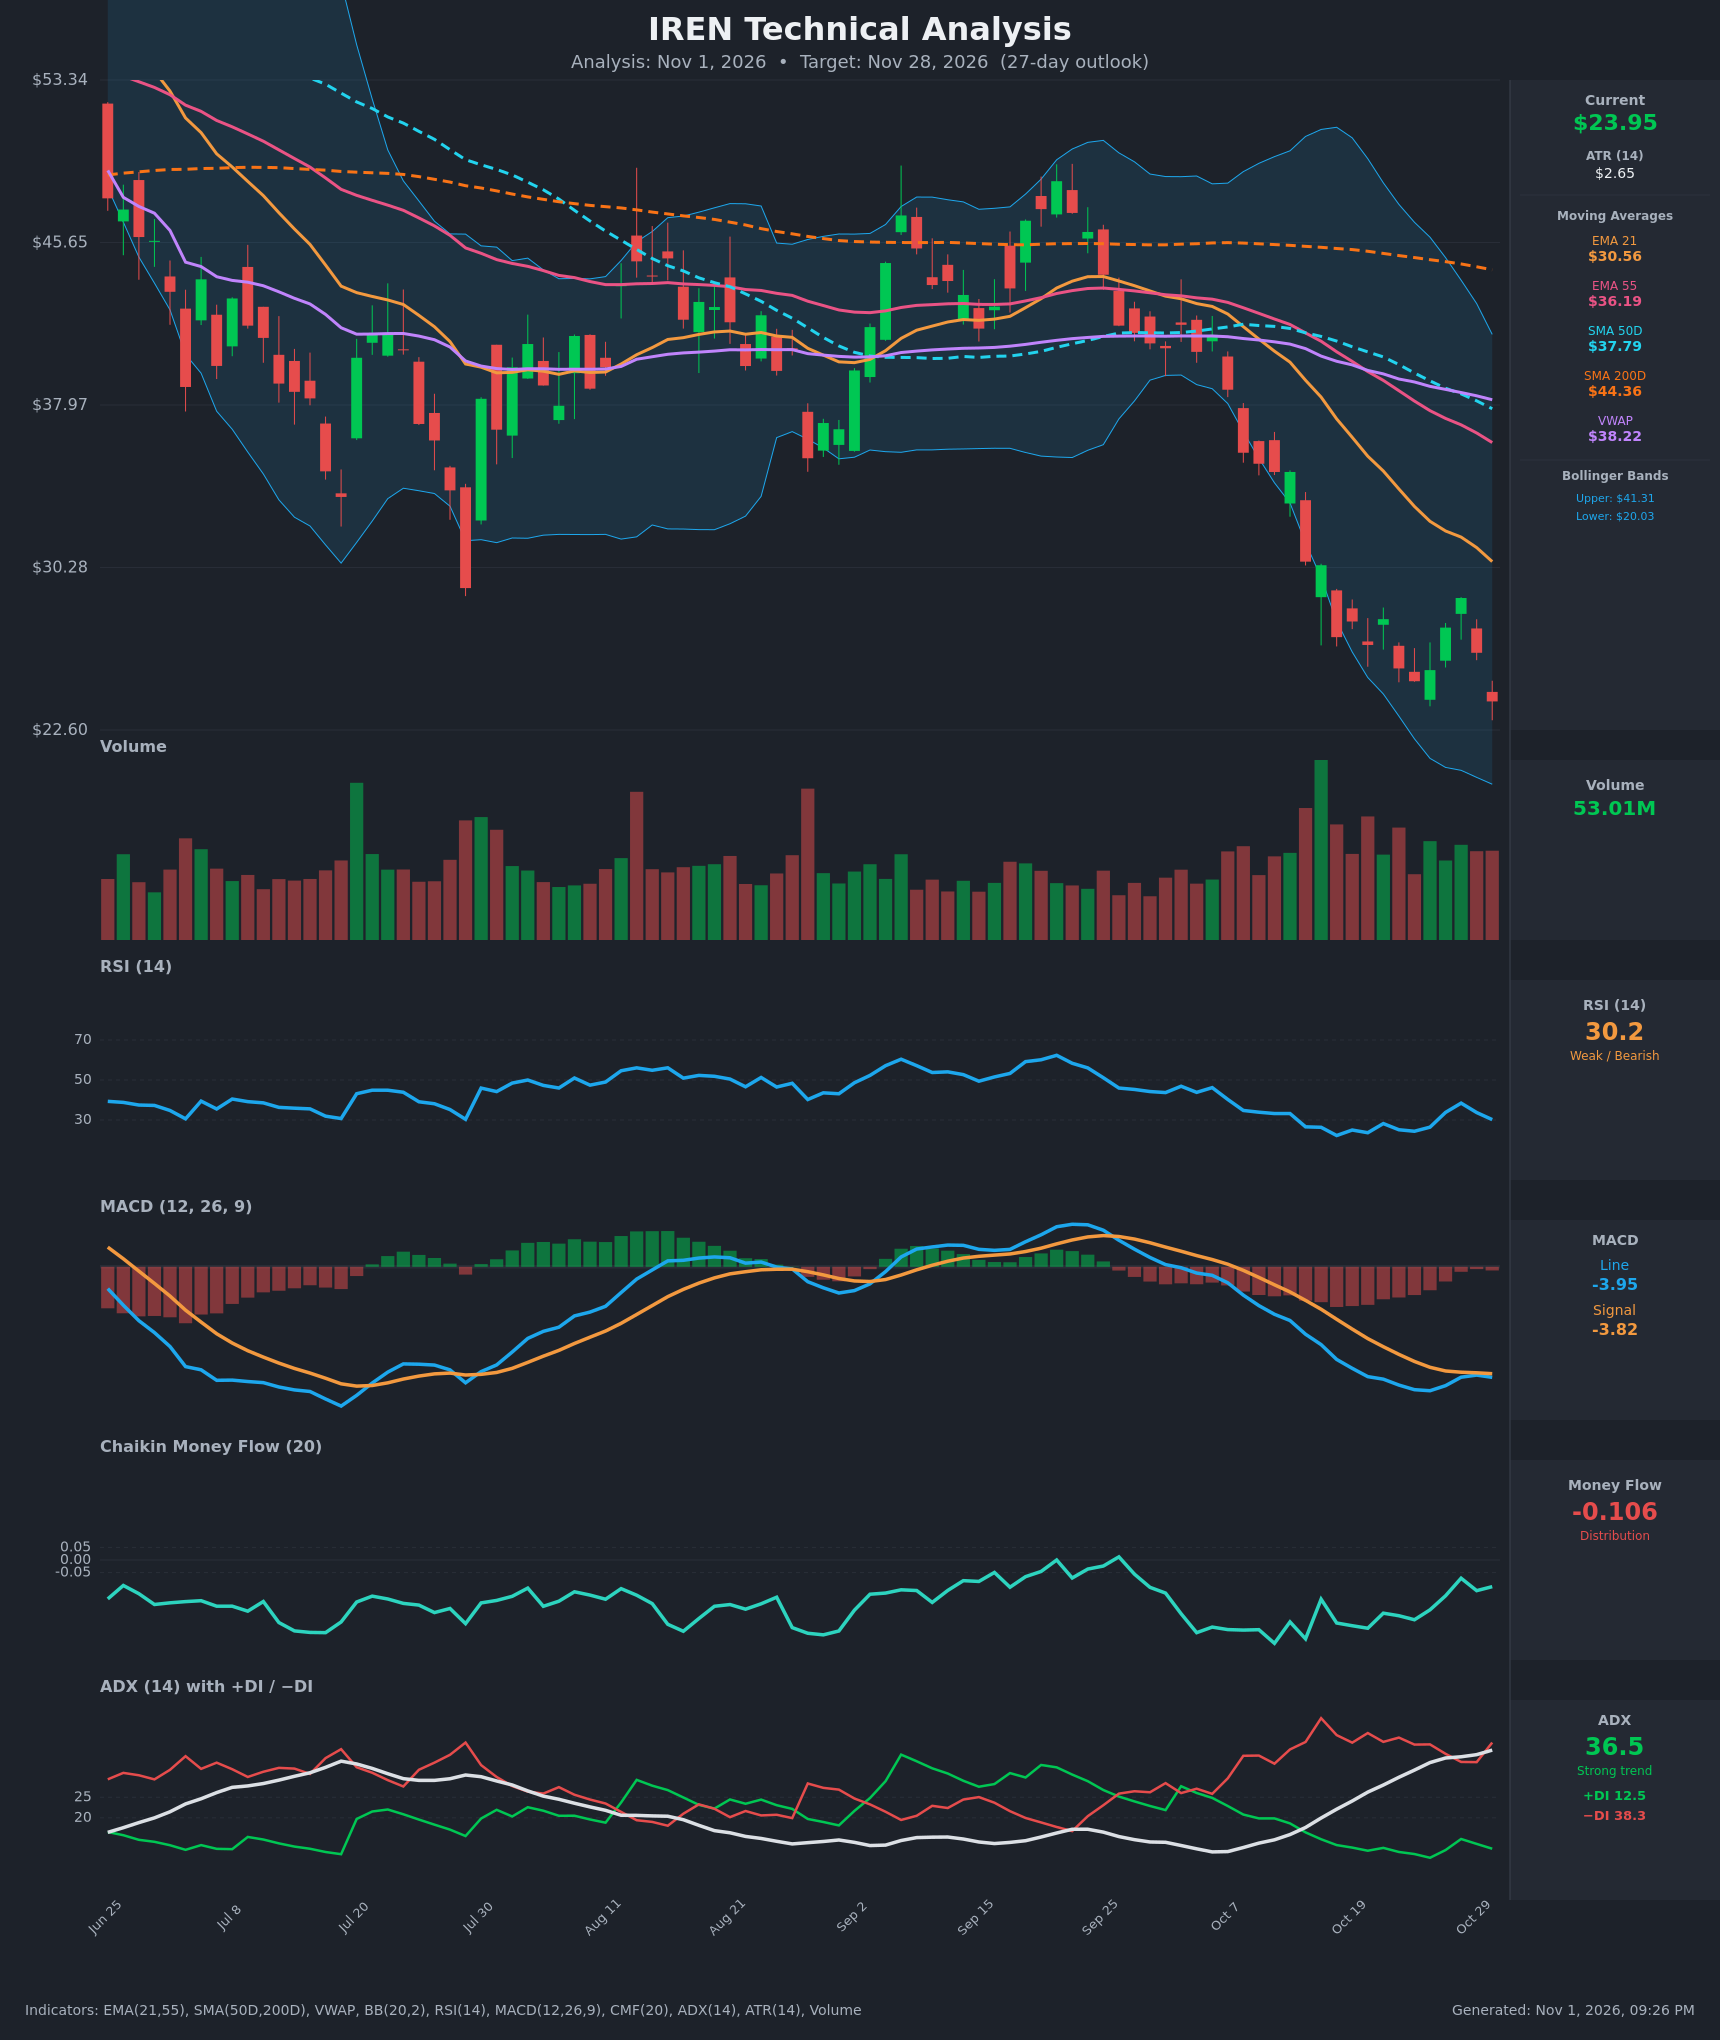
- RSI (14): 30.20, right at the oversold threshold. It bounced from 22 (Oct 16) to 38 (Oct 28), then rolled over again, so the bounce failed. Momentum is weak, with no bullish divergence yet. [Bearish]
- 20 EMA (EMA 21): $30.56, sloping down steeply. Price is about 22% below it, so the average is overhead resistance. EMA 21 is also below EMA 55 ($36.19), and that bearish alignment has held for weeks. [Bearish]
- MACD: Line -3.95 is below Signal -3.82, with a small negative histogram (about -0.13). Both lines are deeply negative. The line had been recovering toward the signal and has now turned back down, which signals renewed downside momentum. [Bearish]
- Bollinger Bands (20): Upper $41.31, lower $20.03, and the bands are wide, so volatility is expanded. Price at $23.95 sits in the lower quarter of the bands. It has been hugging the lower band and "walking" it since mid-October. The mid-band is far above at about $30.7. [Bearish]
- CMF (20): -0.106, below the -0.05 threshold. It has been persistently negative (-0.07 to -0.33) throughout the decline, which shows sustained distribution. [Distribution]
- ADX (14): 36.5 and rising steadily from 15 two weeks ago. −DI at 38.3 is far above +DI at 12.5, so bears are firmly in control. This is a strong, established downtrend. [Strong Trend – Bearish]
- Volume: 53.01M on a red candle that closed at a new low. Volume has been elevated on the breakdown, including a big spike during the Oct 14–16 drop. Recent bounces came on lower volume, while selling comes on higher volume. [Bearish – selling pressure confirmed]
DIVERGENCES & TRENDS
- There is no bullish RSI or MACD divergence. The price low on Oct 30 ($23.95) is below the Oct 23 low ($24.91), and RSI (30.2) is above its Oct 23 value (24.4). That is a mild bullish RSI divergence, but it is not confirmed by MACD or CMF.
- MACD made a lower low (-4.43 on Oct 26) and is now at -3.95. The line is below the signal and rolling over, so the earlier hook toward a bullish cross failed.
- All major moving averages are stacked bearishly: Price < EMA21 ($30.56) < EMA55 ($36.19) < SMA50D ($37.79) < VWAP ($38.22) < SMA200D ($44.36).
- SMA50D is already below SMA200D (a death cross in place), and price is far below SMA200D, so the long-term trend is down.
- ADX is rising with −DI dominant, so the trend is strengthening rather than exhausting. −DI is turning back up (33.6 → 38.3) while +DI fades.
- The recent lower highs ($28.84 on Oct 28 versus $27.84 on Oct 21 and $34.80 on Oct 13) confirm that rallies are being sold.
CHART PATTERNS
- Bearish Flag / Pennant breakdown: After the sharp drop from about $34.80 to about $25, price consolidated in a narrow, slightly rising range ($24.9–$28.8) from Oct 22 to Oct 29. The Oct 30 close at $23.95 breaks below that range, which resembles a Bearish Flag/Pennant resolving lower. The measured move is the prior flagpole (about $9–10) projected from the breakdown, pointing to roughly $15–17. That is beyond a 27-day base case, but it shows the downside potential.
- Descending channel on the daily: The series of lower highs and lower lows since early October (and the lower-high structure from the Sep peak) is consistent with a persistent downtrend. There is no reversal formation yet. A Double Bottom or Falling Wedge would need to form first, and neither has.
- Support zone: The lower Bollinger Band at about $20.03 is the next logical support, with the round number $20 nearby.
POTENTIAL SCENARIOS
- Scenario 1: Bearish Trend Continuation — The flag breakdown holds, ADX keeps rising with −DI dominant, and rallies fail at the $26–28 area, which also caps the bounce. Price grinds toward the lower Bollinger Band and the $20 round number. Trigger: daily close below $23.50 on heavy volume. Target: $20.00–$22.00. Invalidation: daily close above $28.84 (the last lower high). (52% probability)
- Scenario 2: Bullish Oversold Relief Bounce — RSI at the oversold line, a mild RSI divergence, and a price far below the 21 EMA could trigger a short-covering rally. It would probably stall below the declining EMA 21 and fail beneath the $30–31 area. Trigger: reclaim of $26.25 and then $28.84 on rising volume with CMF turning toward -0.05. Target: $28.00–$30.50. Invalidation: close below $22.60. (33% probability)
- Scenario 3: Neutral Basing Range — Price stabilizes between about $21 and $26 as selling exhausts and ADX peaks. Trigger: several closes holding $22–$26 with volume contracting. Target: about $24. Invalidation: a close outside $20.00–$27.50. (15% probability)
PRICE TARGETS
- Target Price: $22.00 (27-day outlook)
- Expected Range: $20.25 to $24.50 (width $4.25 ≈ 17.7% of the current price, which fits a roughly one-month horizon)
- Key Levels: Support at $20.03 (lower Bollinger Band, near the $20 round number), Resistance at $26.25 (Oct 29 close and the first rejection zone, with $28.84 and EMA 21 at $30.56 above)
OVERALL BIAS
OVERALL BIAS: BEARISH - A strong, rising-ADX downtrend with −DI at 38 against +DI at 12.5, persistent CMF distribution, price below every key moving average, and a failed bounce with a fresh closing low on heavy volume all outweigh the oversold RSI. A relief bounce is possible, but the trend favors continuation toward $20–22.
This is educational analysis and not financial advice.