MSTR 27-day bearish forecast — Nov 1, 2026
- Bias: Bearish
- Timeframe: 27 days (made Nov 1, 2026, target date Nov 27, 2026)
- Price at analysis: $130.51
- Price target: $124.00
- Expected range: $114.00 – $134.00
- Result: Pending — graded after the close on Nov 27, 2026
Get a free AI analysis of MSTR today
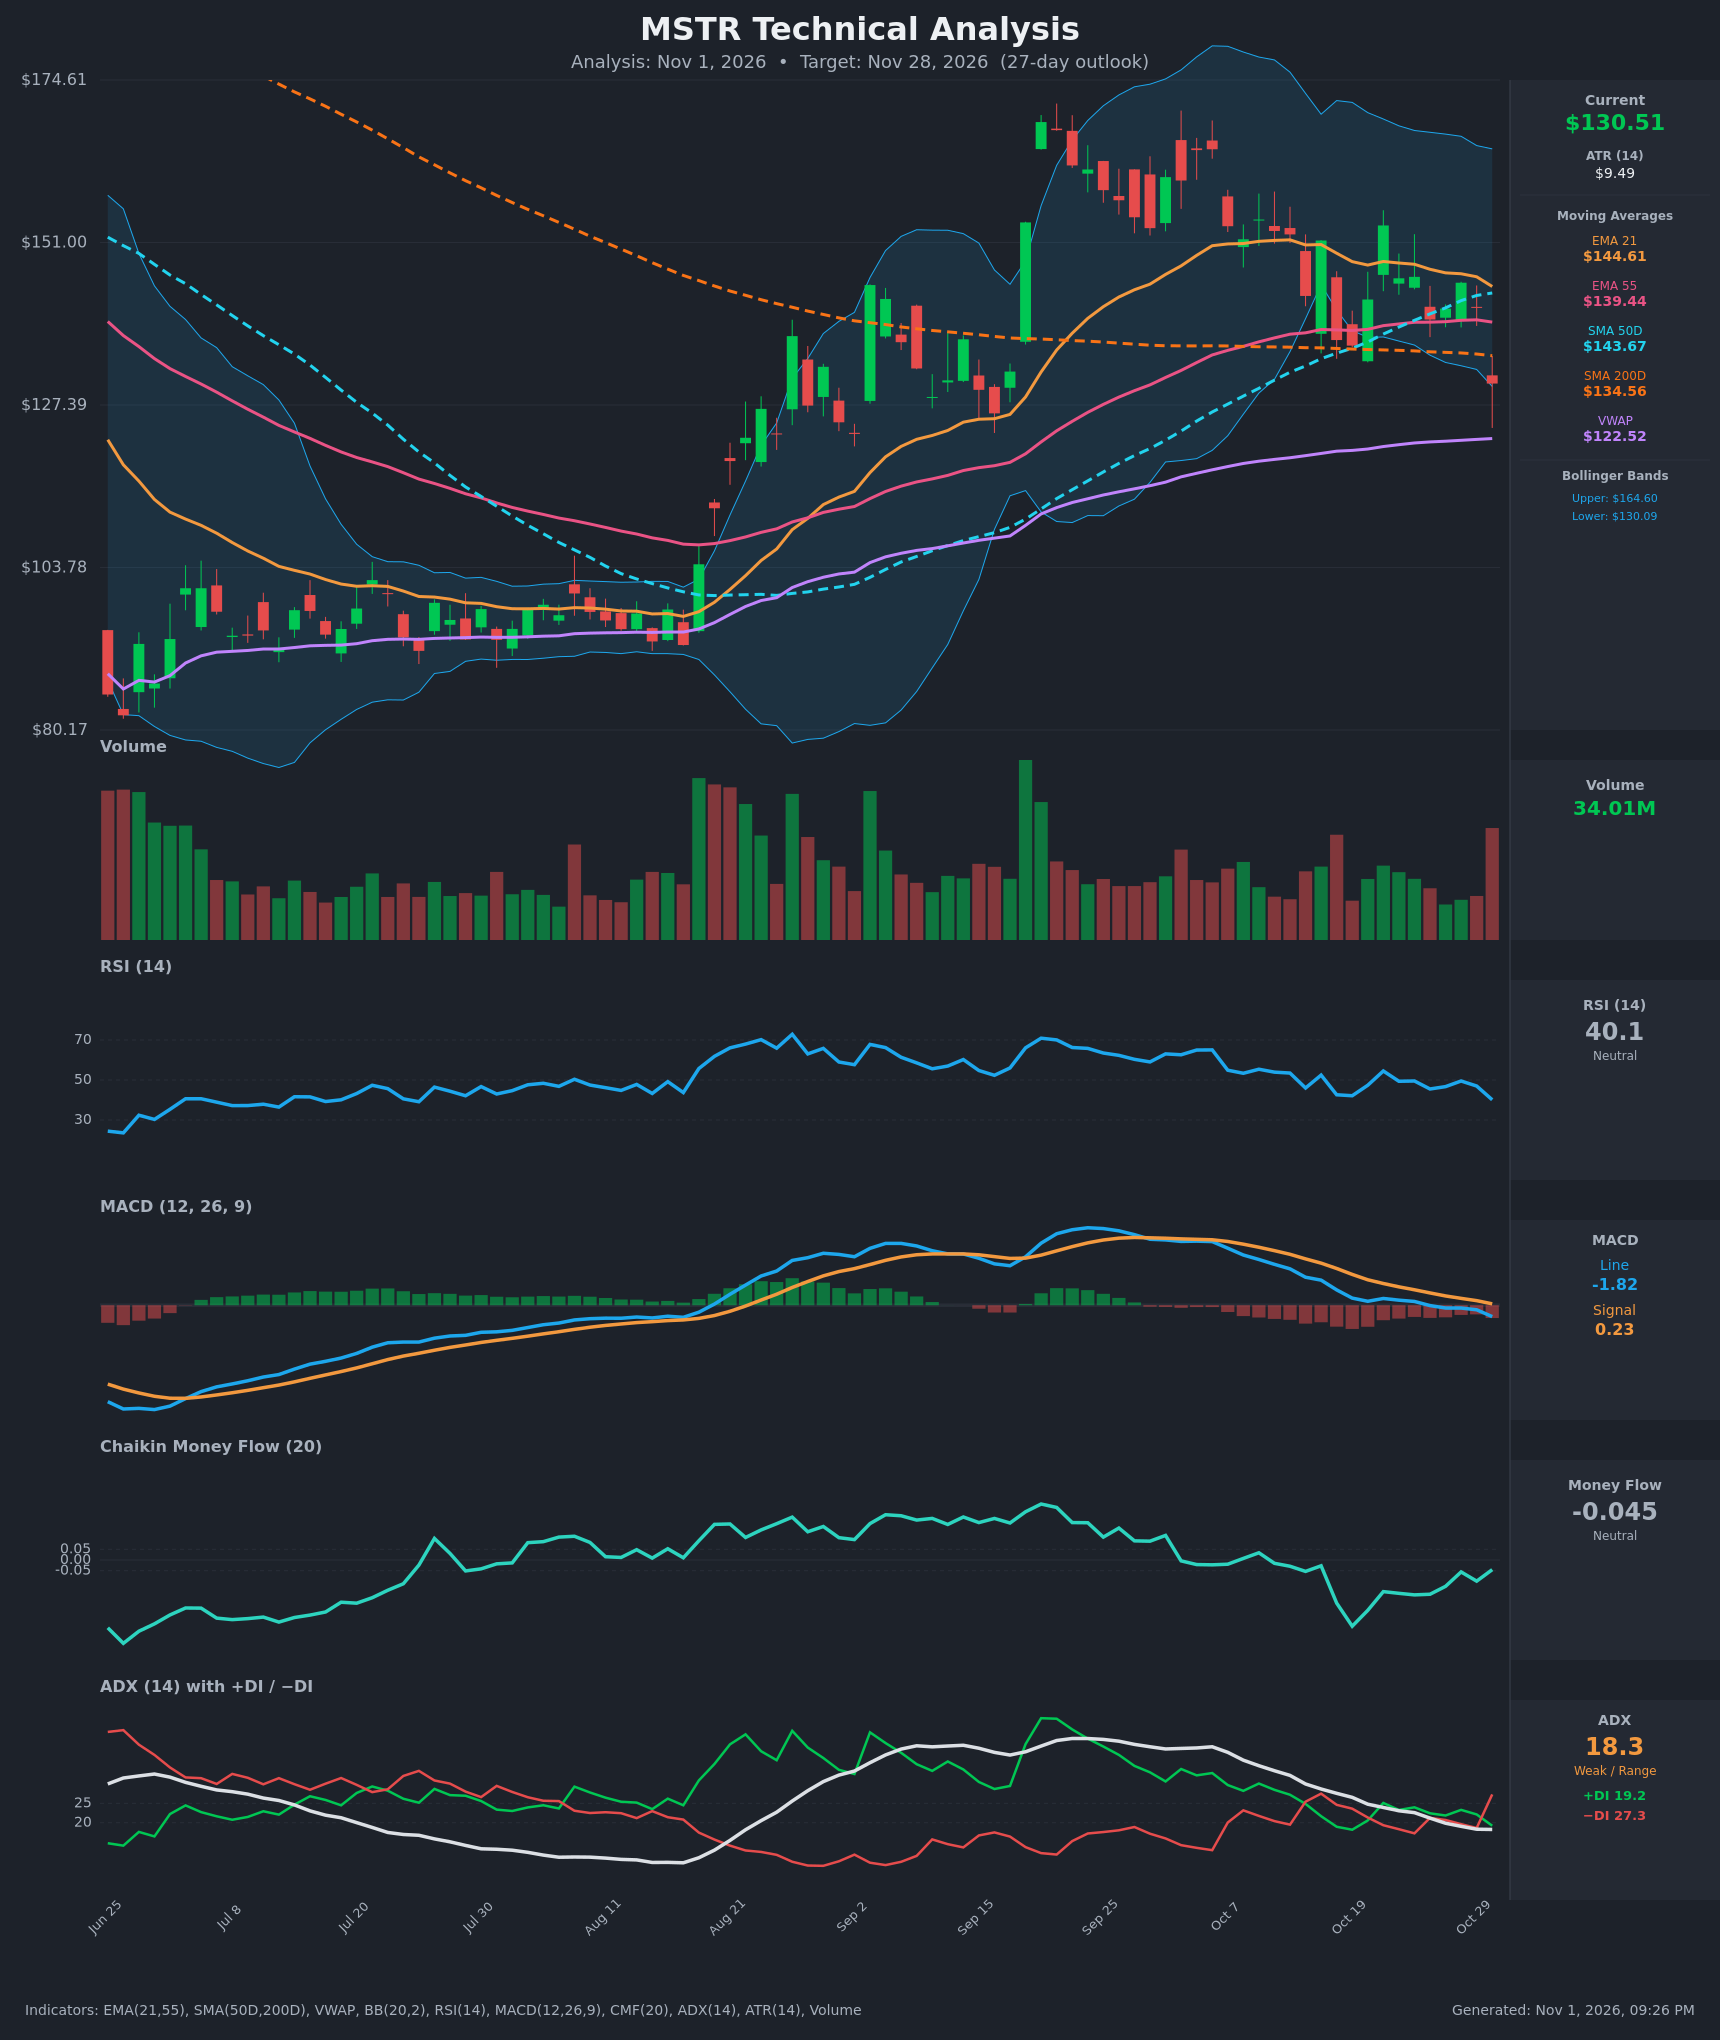
Analysis
TECHNICAL INDICATORS
- RSI (14): 40.11, falling from 49.5 on Oct 28 and well below the 50 midline. It is not yet oversold (<30), so there is room for more downside before an oversold bounce is likely. [Bearish]
- 20 EMA (EMA 21): $144.61. Price at $130.51 is about 10% below it, and the EMA is rolling over from $151. It now acts as overhead resistance. The EMA 21 is still above the EMA 55 ($139.44), so no bearish EMA cross has occurred yet, but the gap has narrowed from about $14 to about $5. [Bearish]
- MACD: Line -1.82 is below Signal 0.23, so the histogram is negative (-2.05) and widening. The bearish crossover occurred around Oct 26, and the line has just dropped below zero. [Bearish]
- Bollinger Bands (20): The upper band is $164.61 and the lower is $130.09. Price at $130.51 is hugging the lower band after a roughly 7.8% one-day drop. The bands are still wide, so volatility is elevated. A lower-band tag can mean a short-term bounce, but in a downtrend it often becomes a "band walk". [Bearish]
- CMF (20): -0.045, between ±0.05, so technically neutral. It has weakened from positive territory in September to a low near -0.31 on Oct 19, and is now recovering slightly. This shows distribution that has not yet fully reversed. [Neutral]
- ADX (14): 18.3, which is weak/range-bound, and has fallen from 33 on Oct 12. −DI (27.3) has just crossed above +DI (19.2) with a sharp widening, so bears are taking control. The trend is not yet strong, but the direction is turning down. [Weak Trend, bearish tilt]
- Volume: 34.01M, a visible spike on the latest red candle and the highest volume in several weeks. That points to a high-volume breakdown or capitulation-style move rather than a quiet drift. [Bearish, heavy-volume selling]
Moving average context:
- Price is below the SMA 200 ($134.56), the SMA 50 ($143.67), the EMA 55 and the EMA 21.
- VWAP is $122.52 and still about 6% below price.
- The SMA 50 is above the SMA 200 (an earlier golden cross), but the SMA 50 is flattening and the SMA 200 is sloping down slowly.
DIVERGENCES & TRENDS
- No clear bullish divergence yet. RSI at 40 is making a lower low alongside price, which confirms the weakness.
- Momentum has been deteriorating since late September. The MACD peaked, crossed down and is now negative. RSI has gone from about 70 to 40, and ADX has dropped from the mid-30s to 18 as the rally lost steam.
- Price has made lower highs since the ~$170 peak in late September (about $160s early October, then $153 on Oct 21), and has now lost the $135-$140 cluster of the EMA 55 and SMA 200.
- The −DI/+DI bearish crossover on Oct 30 and the close below the SMA 200 are fresh bearish signals.
- CMF is turning up slightly from its lows while price falls. This is a minor sign of a bounce attempt, not a divergence signal.
CHART PATTERNS
- Bearish Double Top / Rounded Top (reversal): The ~$170 peak and the lower high around $160-$165 followed by a lower-high structure at $153 match a bearish top. The neckline sits around $130-$135, which price is now breaking. The full measured move (about $35-$40) would point toward the $95-$100 area, but that is well beyond a 27-day horizon. A partial move toward $120-$122 (VWAP) is more realistic.
- Possible Bearish Descending Triangle / Pennant (continuation): Since Oct 7 price has made lower highs against a flat floor around $130-$135. A break below that floor on high volume is consistent with a descending triangle breakdown.
- The setup is not a perfect textbook match. A failed breakdown that reclaims $135 would invalidate it.
POTENTIAL SCENARIOS
- Scenario 1: Bearish Breakdown Continuation — Price loses the $130 support and the lower Bollinger Band, with −DI staying above +DI and MACD staying negative. Sellers push toward VWAP and the Aug breakout area. Trigger: daily close below $128-$130 on above-average volume. Target: $122.50 (VWAP) first, then $115-$118. Invalidation: daily close back above $135 (SMA 200) and then $139.44 (EMA 55). (50% probability)
- Scenario 2: Bullish Oversold Bounce / Reclaim — Heavy-volume flush into the lower band marks short-term capitulation, and price mean-reverts back toward the moving averages. Trigger: close above $134.56 (SMA 200) with RSI turning up above 45 and CMF rising above +0.05. Target: $139.44 (EMA 55), then $144-$145 (EMA 21 / SMA 50). Invalidation: close below $126. (30% probability)
- Scenario 3: Neutral Range Chop — Price consolidates between VWAP and the SMA 200 while ADX stays below 20. Trigger: holding $122-$135 with no decisive close outside. Target: $126-$132. Invalidation: close outside $120-$137. (20% probability)
PRICE TARGETS
- Target Price: $124.00 (27-day horizon, about -5% from $130.51)
- Expected Range: $114.00 to $134.00 (width $20.00, about 15.3% of current price, consistent with the 12-18% guidance for 30-60 days scaled to 27 days)
- Key Levels: Support at $122.52 (VWAP), Resistance at $134.56 (SMA 200D)
OVERALL BIAS
OVERALL BIAS: BEARISH - Price has broken below the SMA 200, EMA 21, EMA 55 and SMA 50. MACD is in a bearish cross and −DI has taken over from +DI, with heavy volume on the breakdown candle. Price sits on the lower Bollinger Band, so a bounce is possible, but the bearish indicators outweigh it. The most likely path is a drift toward VWAP near $122-$124.
This is educational analysis and not financial advice.