NIO 27-day bearish forecast — Nov 1, 2026
- Bias: Bearish
- Timeframe: 27 days (made Nov 1, 2026, target date Nov 27, 2026)
- Price at analysis: $3.21
- Price target: $3.05
- Expected range: $2.65 – $3.55
- Result: Pending — graded after the close on Nov 27, 2026
Get a free AI analysis of NIO today
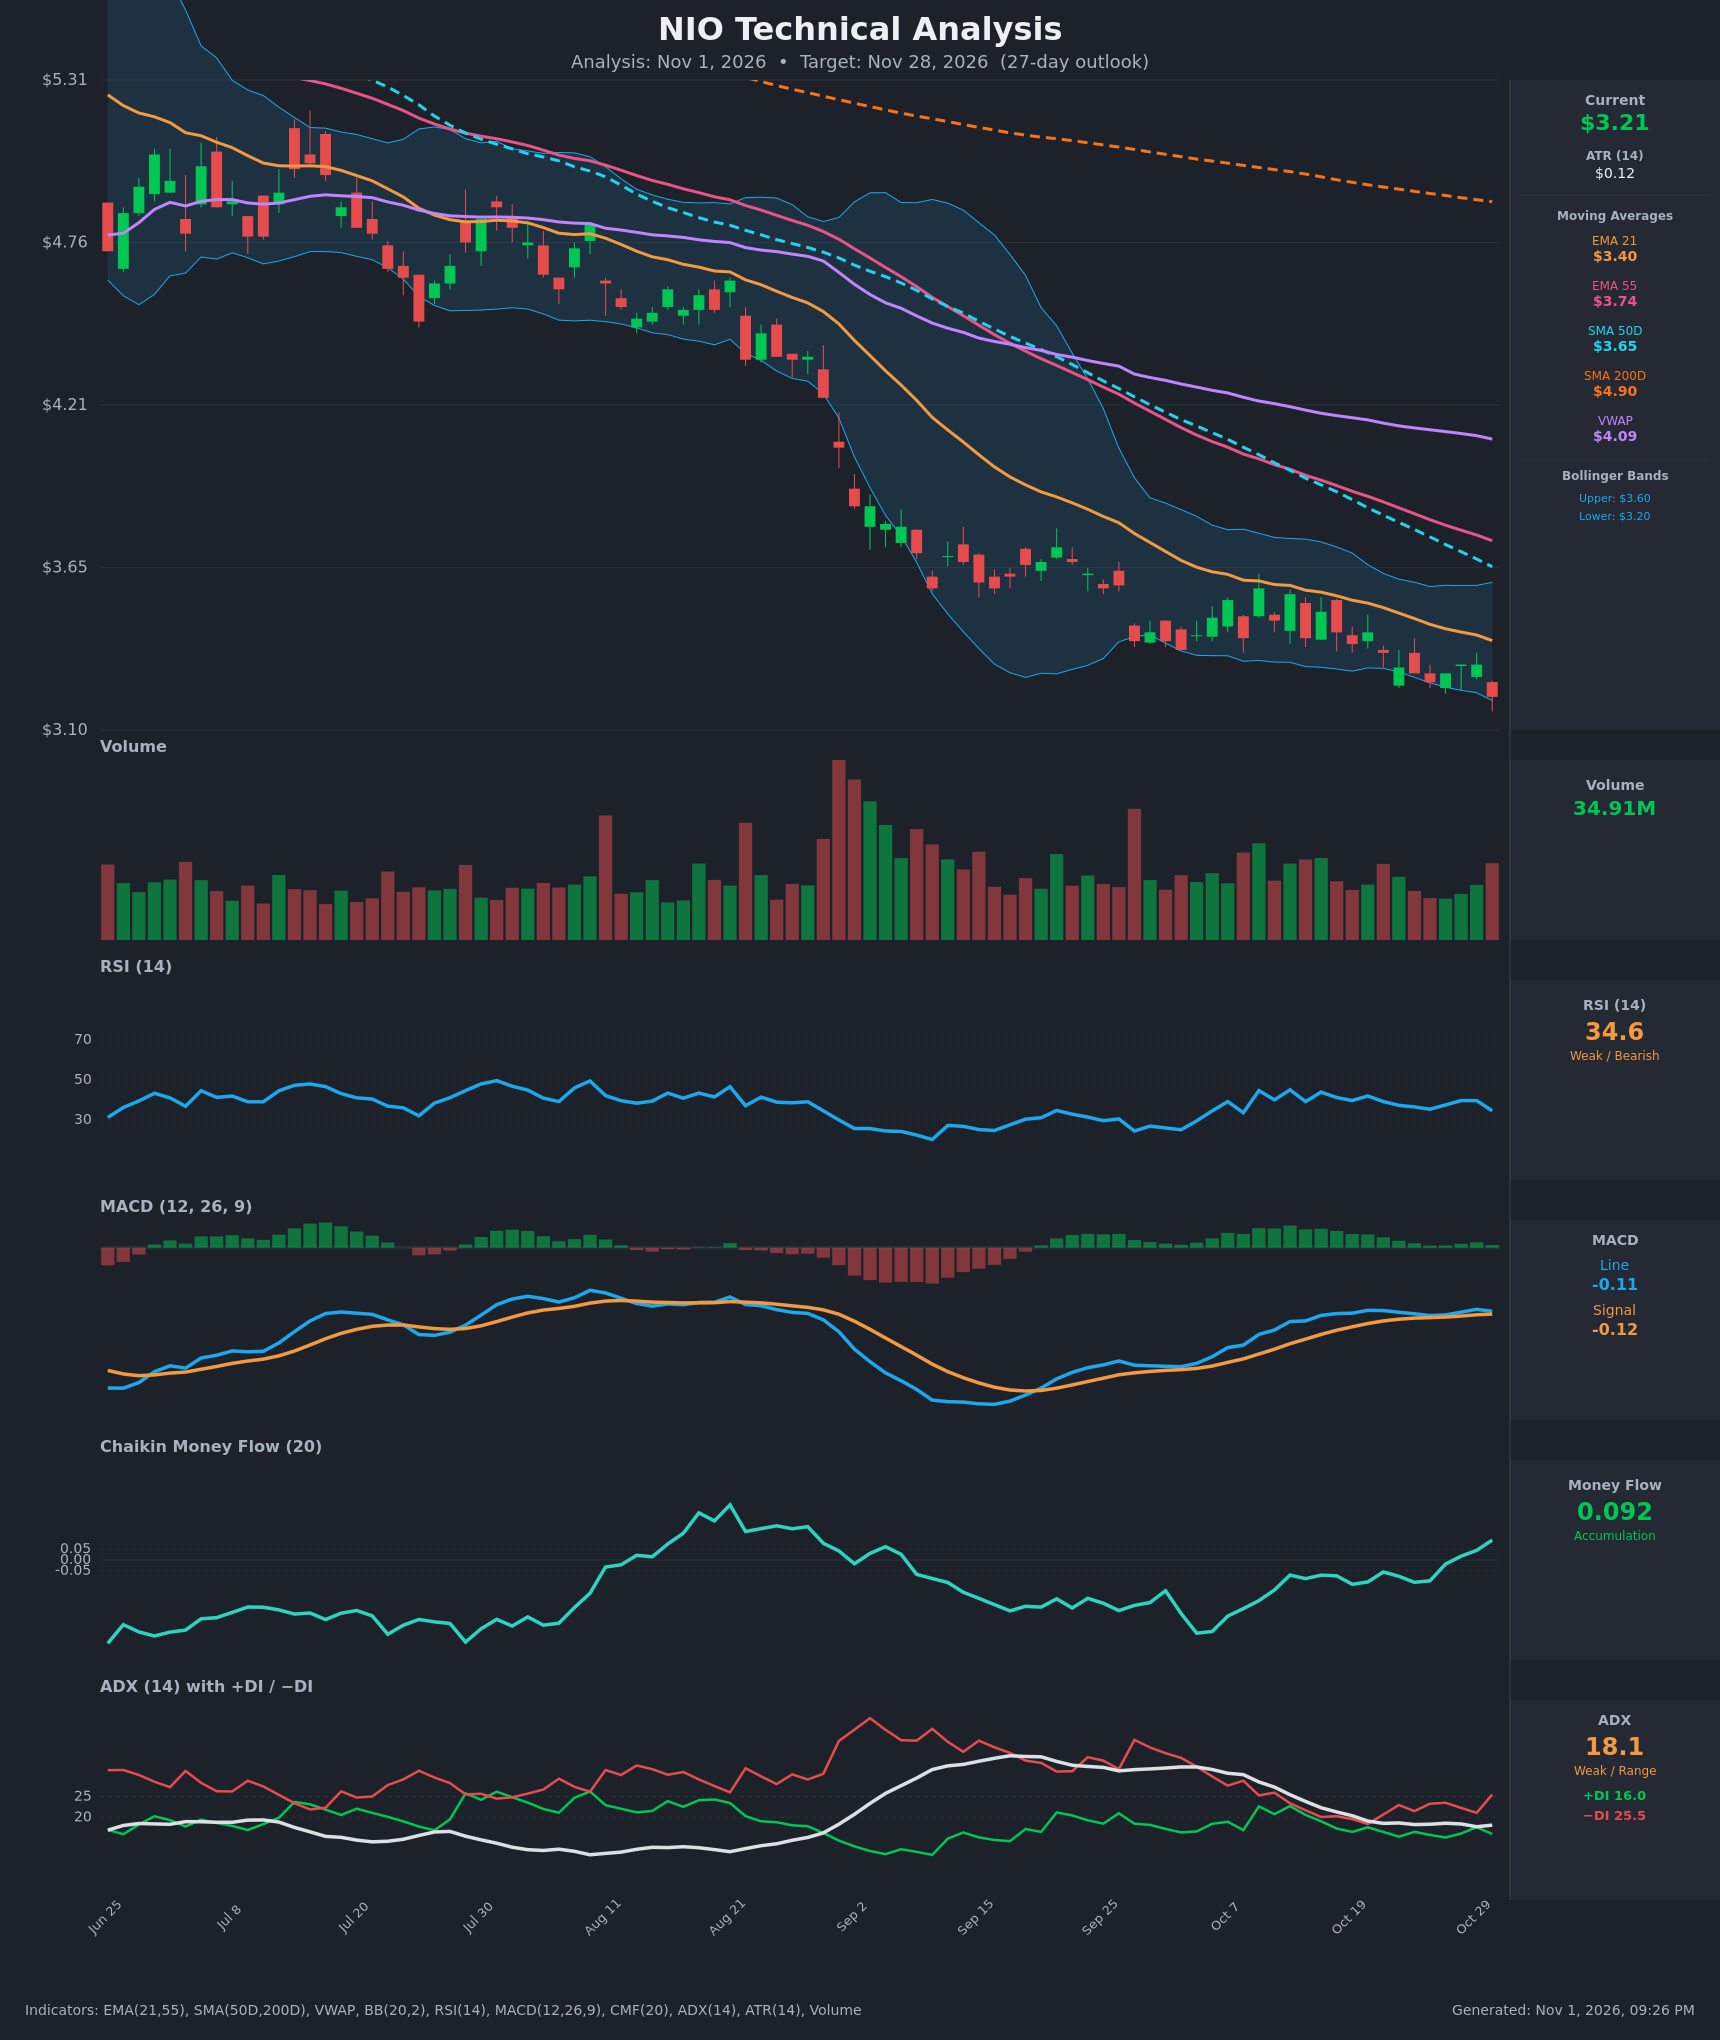
Analysis
TECHNICAL INDICATORS
- RSI (14): 34.60, near oversold but not below 30. It has been stuck in a 35–45 band for weeks and dipped on the last bar from 39.7. Momentum is weak with no bullish reversal yet. [Bearish]
- 20 EMA (EMA 21): $3.40, with price at $3.21 about 5.6% below it. The EMA is sloping down, so it acts as overhead resistance. EMA 21 is also below EMA 55 ($3.74), which is a bearish alignment. [Bearish]
- MACD: Line -0.112 vs signal -0.117, so the line is marginally above the signal. The histogram is slightly positive (about +0.005) but flat. Both lines are negative and the line has stalled, so this is a weak, fading positive that reads as a flat, non-confirming signal. [Neutral]
- Bollinger Bands (20): Upper $3.60, lower $3.197, and price at $3.21 sits right on the lower band. The bands are narrow after a squeeze, so price is walking the lower band in a downtrend. This is a continuation signal more than a clean reversal, though a mean-reversion bounce toward the mid-band (~$3.40) is possible. [Bearish]
- CMF (20): +0.092, above the +0.05 threshold and rising steadily from -0.10 over the past two weeks. This shows accumulation and a bullish divergence against falling price. [Accumulation]
- ADX (14): 18.1 with +DI 16.0 and −DI 25.5. The trend is weak, but −DI is clearly on top, so the bears retain directional control. ADX is below 20, which fits the compressed range, and the −DI spike on the last bar adds to the bearish tilt. [Weak Trend, Bearish direction]
- Volume: 34.91M, near average and not showing capitulation. The recent volume bars are muted compared with the Aug–Sep selloff spike. Selling is orderly rather than panicked, and there is no exhaustion volume yet. [Neutral/Mildly Bearish]
DIVERGENCES & TRENDS
- Bullish CMF divergence: Price made lower lows (from $3.47 to $3.21) while CMF rose from -0.139 to +0.092. This suggests quiet accumulation, but it has not yet been confirmed by price.
- RSI: No new RSI low. It held around 35 while price made new lows, which is a mild positive. The last bar (34.6) is back down, so it is not confirmed.
- MACD: It has flattened near its signal line. The brief bullish cross has no thrust and the line is not rising.
- Moving averages: Price is below EMA21 ($3.40), EMA55 ($3.74), SMA50D ($3.65), SMA200D ($4.90) and VWAP ($4.09). There is a death cross in place (SMA50D below SMA200D), the long-term trend is down, and every average is declining.
- Trend: Lower highs and lower lows persist since the Aug breakdown. Price has been a stair-step decline with small candles around $3.30–3.55, and it just broke below the Oct consolidation low of ~$3.26.
- Bollinger: Price is pinned to the lower band after a squeeze, a sign of persistent downward pressure.
CHART PATTERNS
- Bearish Pennant / descending channel (continuation): After the sharp Aug–Sep drop, price consolidated in a tight, slightly downward-sloping range ($3.26–$3.60). Today's close at $3.21 breaks beneath that base, which is consistent with the Bearish Pennant/Flag continuation. The measured move of the prior leg is large, but since the price is already extended, I take only a fraction of it.
- Descending channel under falling averages: Lower highs are capped by EMA21, and each bounce failed beneath it.
- Possible Bullish Falling Wedge: The narrowing range with a CMF divergence hints at a reversal, but there is no breakout above the upper trendline (~$3.40), so it remains unconfirmed.
- Significance: The bearish continuation is the primary read. The CMF accumulation tempers the downside and raises the odds of a relief bounce.
POTENTIAL SCENARIOS
- Scenario 1: Bearish Continuation Breakdown — Price is below all major averages with −DI dominant, and it is breaking the range low and riding the lower Bollinger Band. Sellers keep control and push to new lows in a slow grind. Trigger: daily close below $3.19 (lower band) with expanding volume. Target: $2.90–$3.00. Invalidation: close above $3.40 (EMA21). (50% probability)
- Scenario 2: Bullish Oversold Relief Bounce — The CMF accumulation divergence and the lower-band touch lead to a mean-reversion bounce toward the middle band and EMA21. Trigger: close above $3.30 with RSI turning up through 40 and a MACD histogram increase. Target: $3.45–$3.60 (EMA21, then upper band/SMA50D). Invalidation: close below $3.10. (33% probability)
- Scenario 3: Neutral Choppy Range — Weak ADX (<20) keeps price drifting sideways between $3.10 and $3.40 without a decisive break. Trigger: failure of both breakdown and bounce triggers. Target: $3.15–$3.35. Invalidation: a close outside $3.05–$3.45. (17% probability)
PRICE TARGETS
- Target Price: $3.05 (27-day horizon, Nov 28)
- Expected Range: $2.65 to $3.55. The width is $0.90, or about 28% of the current price. This is somewhat wider than the 12–18% guidance for 30–60 days, which is justified by NIO's volatility (ATR $0.12 ≈ 3.8% daily) and the fact that the stock is at a breakdown point with accumulation conflicting with the trend. A 27-day horizon sits at the top of the 14-21 to 30-60 day bands.
- Key Levels: Support at $3.00 (psychological round level, then $2.80), Resistance at $3.40 (EMA21, and the upper end of the recent consolidation)
OVERALL BIAS
OVERALL BIAS: BEARISH - Price is below every moving average with a death cross in place, −DI is well above +DI, and the stock is riding the lower Bollinger Band after breaking its consolidation low. The CMF accumulation divergence raises the odds of a relief bounce, but it lacks price confirmation, so the downtrend is expected to grind lower toward ~$3.05.
This is educational analysis and not financial advice.