PFE 27-day bullish forecast — Nov 1, 2026
- Bias: Bullish
- Timeframe: 27 days (made Nov 1, 2026, target date Nov 27, 2026)
- Price at analysis: $30.52
- Price target: $31.60
- Expected range: $29.10 – $33.40
- Result: Pending — graded after the close on Nov 27, 2026
Get a free AI analysis of PFE today
Analysis
TECHNICAL INDICATORS
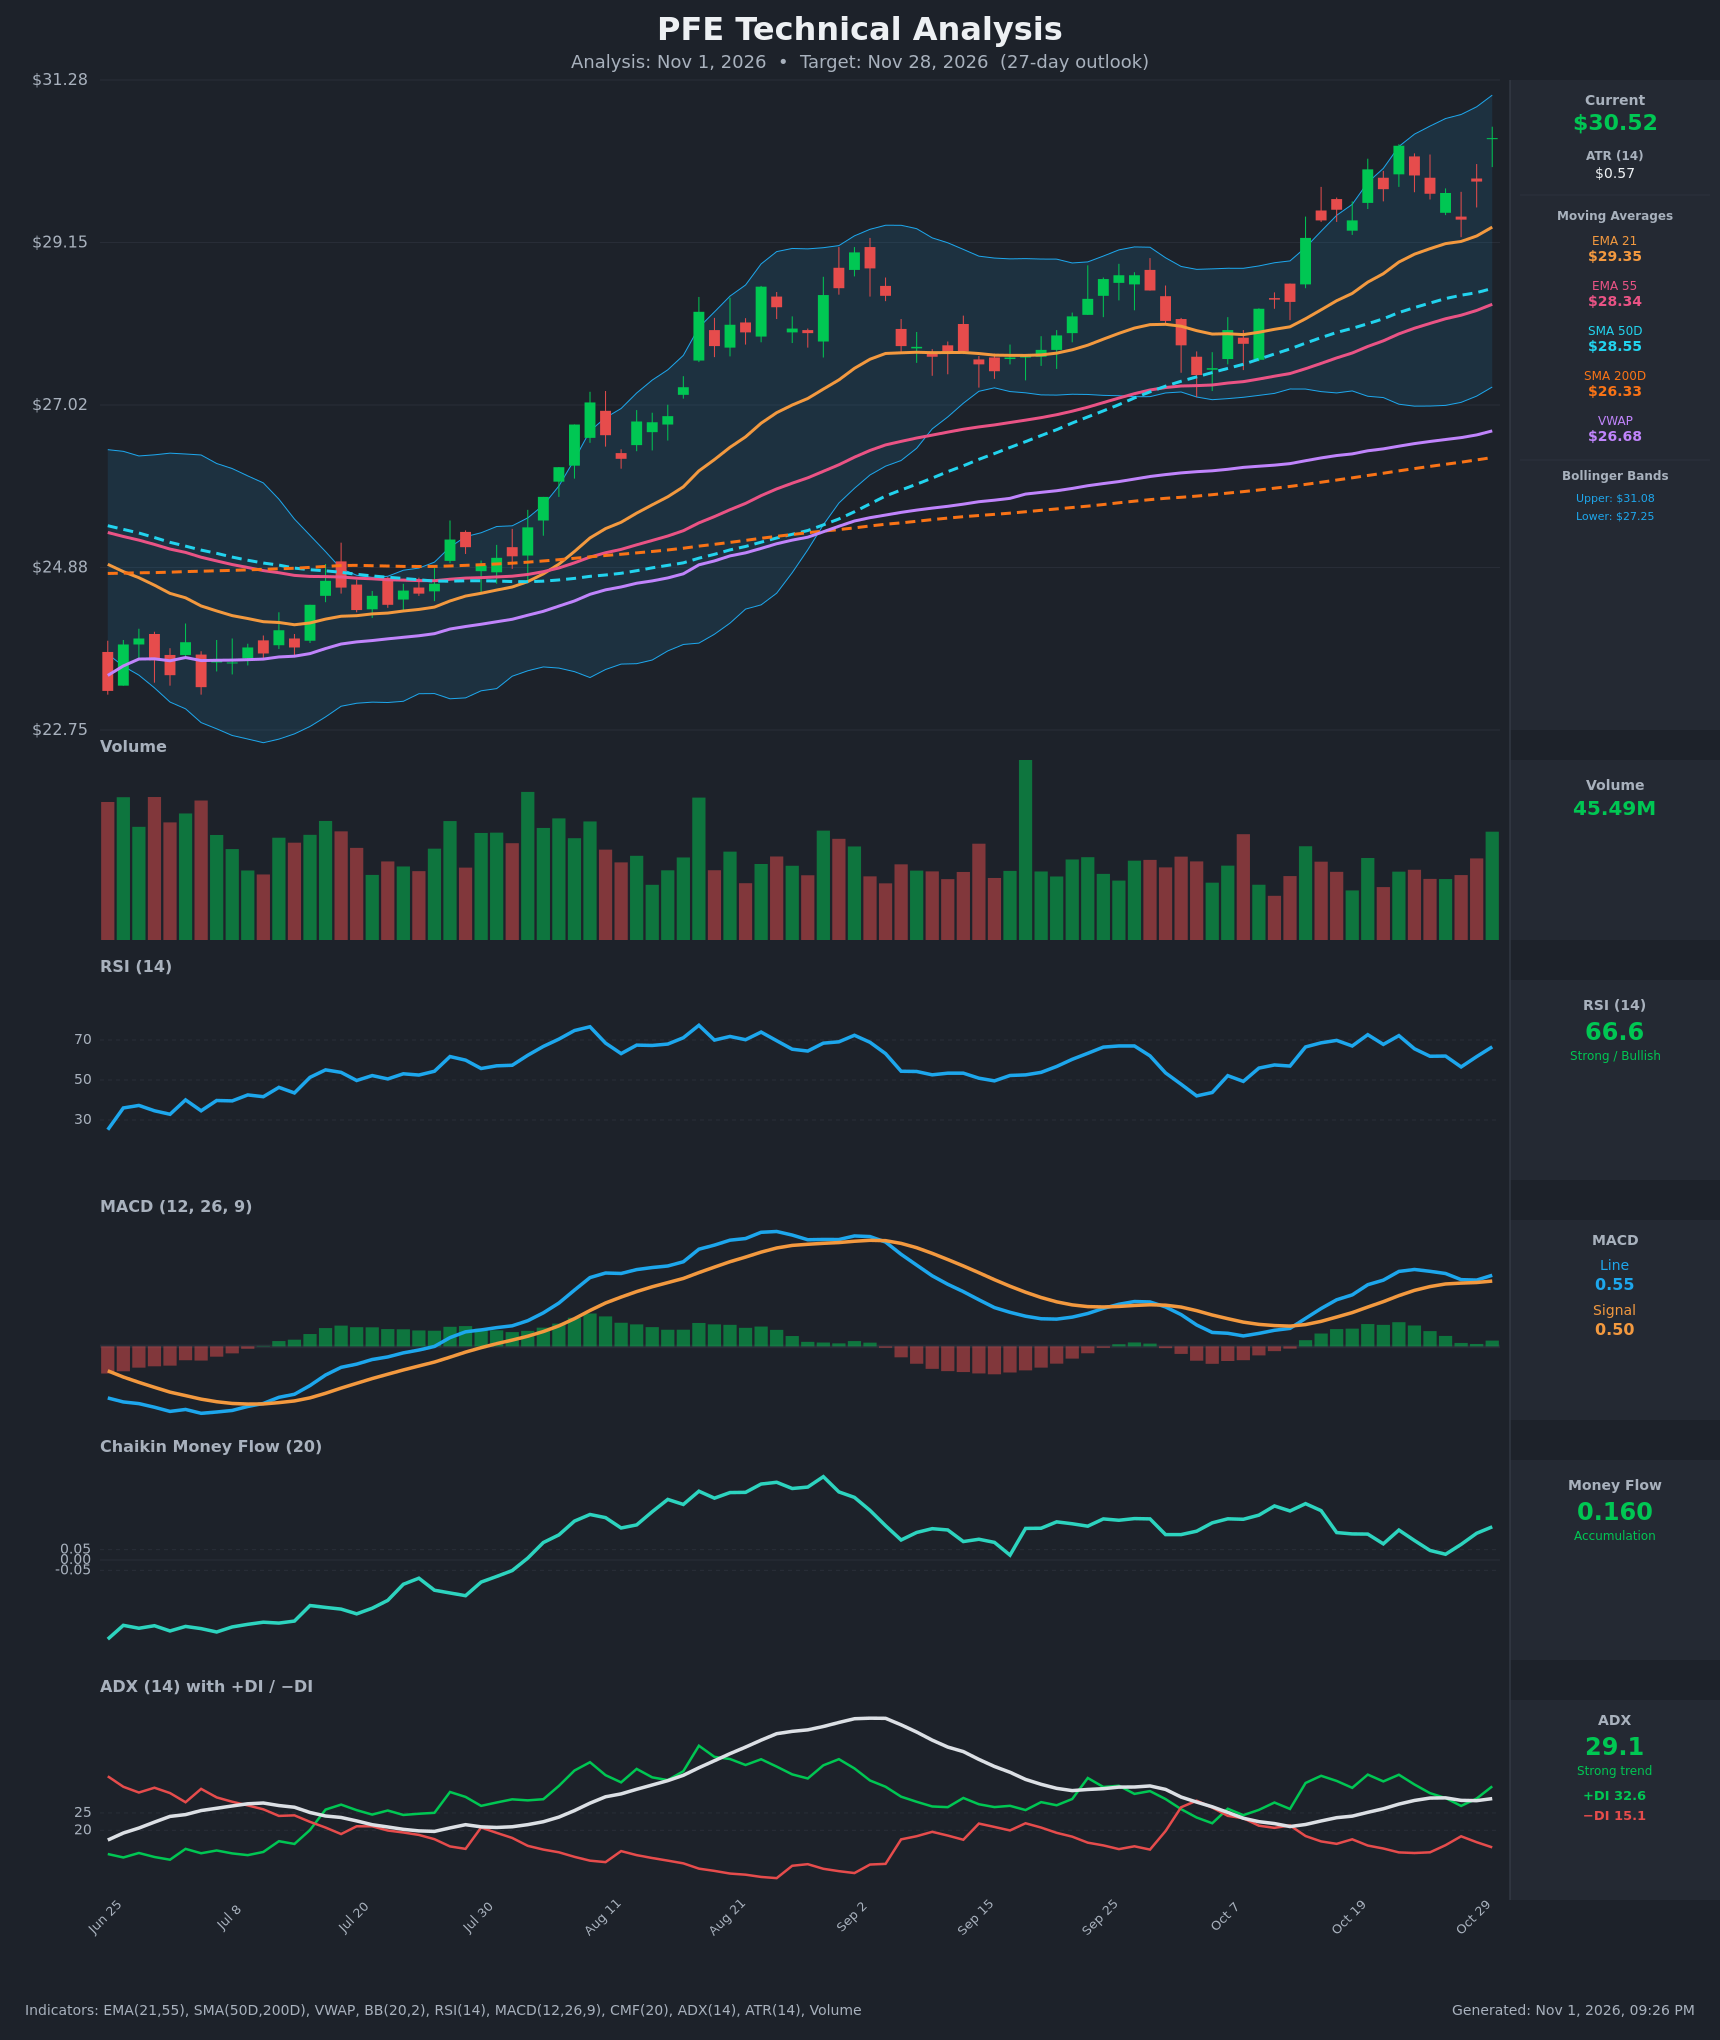
- RSI (14): 66.58, rising from 56.5 on Oct 28 and just under the 70 overbought line. Momentum is strong but not yet stretched. The Oct 22 peak was 72.2, so RSI is making a lower high while price makes a higher high. [Bullish]
- 20 EMA: The 21 EMA is $29.35 and price at $30.52 is about 4% above it. The EMA slopes up and has held as dynamic support throughout the rally, and it sits above the 55 EMA ($28.34), so the short-term trend structure is intact. [Bullish]
- MACD: Line 0.549 is above signal 0.504, with a positive histogram of about +0.045. The histogram narrowed to about +0.02 on Oct 28, then re-expanded over the last two bars. The line is still below its Oct 23 peak of 0.594, so momentum is positive but has not confirmed the new price high. [Bullish]
- Bollinger Bands (20): Upper $31.08, lower $27.25, midline about $29.17. Price is in the upper quarter of the bands, about $0.56 below the upper band. The bands are widening, which fits a trending move. Price can walk the upper band in a strong trend, but it is also a short-term stretch zone. [Bullish]
- CMF (20): 0.160, well above +0.05 and positive throughout the whole recent period. It is down from 0.27 on Oct 14 but rebounding from 0.028 on Oct 27. Buying pressure is persistent. [Accumulation]
- ADX (14): 29.1 and rising from 22 on Oct 12, with +DI 32.6 above −DI 15.1. That is a strong trend with bulls clearly in control, and the DI spread of about 17 points is wide. [Strong Trend – Bullish]
- Volume: 45.49M on the latest up bar, among the higher readings of the recent sessions. The latest push to a new high came on expanding volume, and recent up days are showing larger bars than down days. [Confirms upside move]
Other trend context:
- Price is above the 21 EMA, 55 EMA, 50D SMA ($28.55), 200D SMA ($26.33) and VWAP ($26.68).
- The EMA stack is fully bullish (21 > 55 > 50D > VWAP > 200D).
- The golden cross (50D above 200D) occurred earlier and remains in force.
DIVERGENCES & TRENDS
- Mild bearish divergence: Price closed at $30.52, above the Oct 22 close of $30.42. RSI (66.6 vs 72.2) and the MACD line (0.549 vs 0.594) are both below their Oct 22-23 peaks. This points to some momentum fatigue and a risk of a pullback, but not a reversal signal on its own.
- CMF: It is lower than the mid-October peak (0.27) but positive and turning up again, so there is no distribution divergence.
- ADX: It dipped slightly from 29.3 to 28.5 and has turned back up to 29.1. +DI has recovered from 27.0 to 32.6 while −DI has fallen from 18.3 to 15.1, so the pullback of Oct 26-28 was absorbed.
- Crossovers: There was no MACD bearish crossover; the histogram stayed positive and is re-expanding. The 21/55 EMA gap is widening (about $1.01), and the 50D SMA is rising above both EMAs' slope.
- Trend: The chart shows an uptrend of higher highs and higher lows since the late-July breakout above the 200D SMA, with the Oct 7 consolidation holding above the 55 EMA and 50D SMA.
CHART PATTERNS
- Bullish continuation (Flag/Ascending-channel type): The broader structure is a sustained uptrend with a shallow consolidation from Oct 22-28 (approx. $29.45–$30.42). Price has broken above that range on the latest bar, which resembles a Bullish Flag Pattern resolving upward. The flag-pole measure suggests an upside objective around $31.8–$32.5.
- Earlier base: The Jun–Jul rounded base, followed by the breakout above the 200D SMA, was the foundation of the current trend (similar in spirit to a reversal bottom from the reference diagram).
- Risk: There is no bearish reversal pattern (no double top or head and shoulders) yet. A failure at $30.4–$31.1 followed by a drop back below $29.45 would turn this into a potential Bearish Double Top around $30.4–$30.5 (neckline about $29.45).
POTENTIAL SCENARIOS
- Scenario 1: Bullish Trend Continuation — The strong ADX, a fully stacked MA structure, positive CMF and expanding volume support further upside, with price walking the upper Bollinger Band. Trigger: a daily close above the upper band at about $31.08 on solid volume. Target: $32.00–$33.00 (flag measured move and the band's expansion). Invalidation: a close below $29.35 (21 EMA). (55% probability)
- Scenario 2: Bearish Pullback / Mean Reversion — The momentum divergence and the overextension from the midline lead to a retracement toward the rising averages, with the primary trend intact. Trigger: rejection at $31.08 and a close below $29.80 with MACD histogram turning negative. Target: $28.50–$29.35 (21 EMA / 50D SMA zone). Invalidation: a reclaim of $30.50 on rising volume. (30% probability)
- Scenario 3: Neutral Consolidation — Price digests the gains in a $29.45–$31.10 range while the averages catch up. Trigger: ADX falling below 25 and RSI settling near 55. Target: about $30.00–$30.80. Invalidation: a close above $31.50 or below $29.20. (15% probability)
PRICE TARGETS
For the 27-day timeframe (target date Nov 28, 2026):
- Target Price: $31.60 (about +3.5%, consistent with the bullish trend, tempered by the overbought-leaning upper-band position and the divergence)
- Expected Range: $29.10 to $33.40 (width $4.30, about 14.1% of the current price, within the 12-18% guidance for 30-60 days scaled to a 27-day horizon)
- Key Levels: Support at $29.35 (21 EMA), Resistance at $31.08 (upper Bollinger Band)
OVERALL BIAS
OVERALL BIAS: BULLISH - Price is above every moving average, ADX is at 29 with +DI far above −DI, CMF shows steady accumulation, and the MACD is positive with expanding volume on the breakout bar. The mild RSI/MACD divergence and the stretch near the upper band argue for a possible pullback toward $29.35 along the way, but the trend favors higher levels.
This is educational analysis and not financial advice.