MARA 34-day bearish forecast — Nov 1, 2026
- Bias: Bearish
- Timeframe: 34 days (made Nov 1, 2026, target date Dec 4, 2026)
- Price at analysis: $6.77
- Price target: $6.10
- Expected range: $5.20 – $7.50
- Result: Pending — graded after the close on Dec 4, 2026
Get a free AI analysis of MARA today
Analysis
TECHNICAL INDICATORS
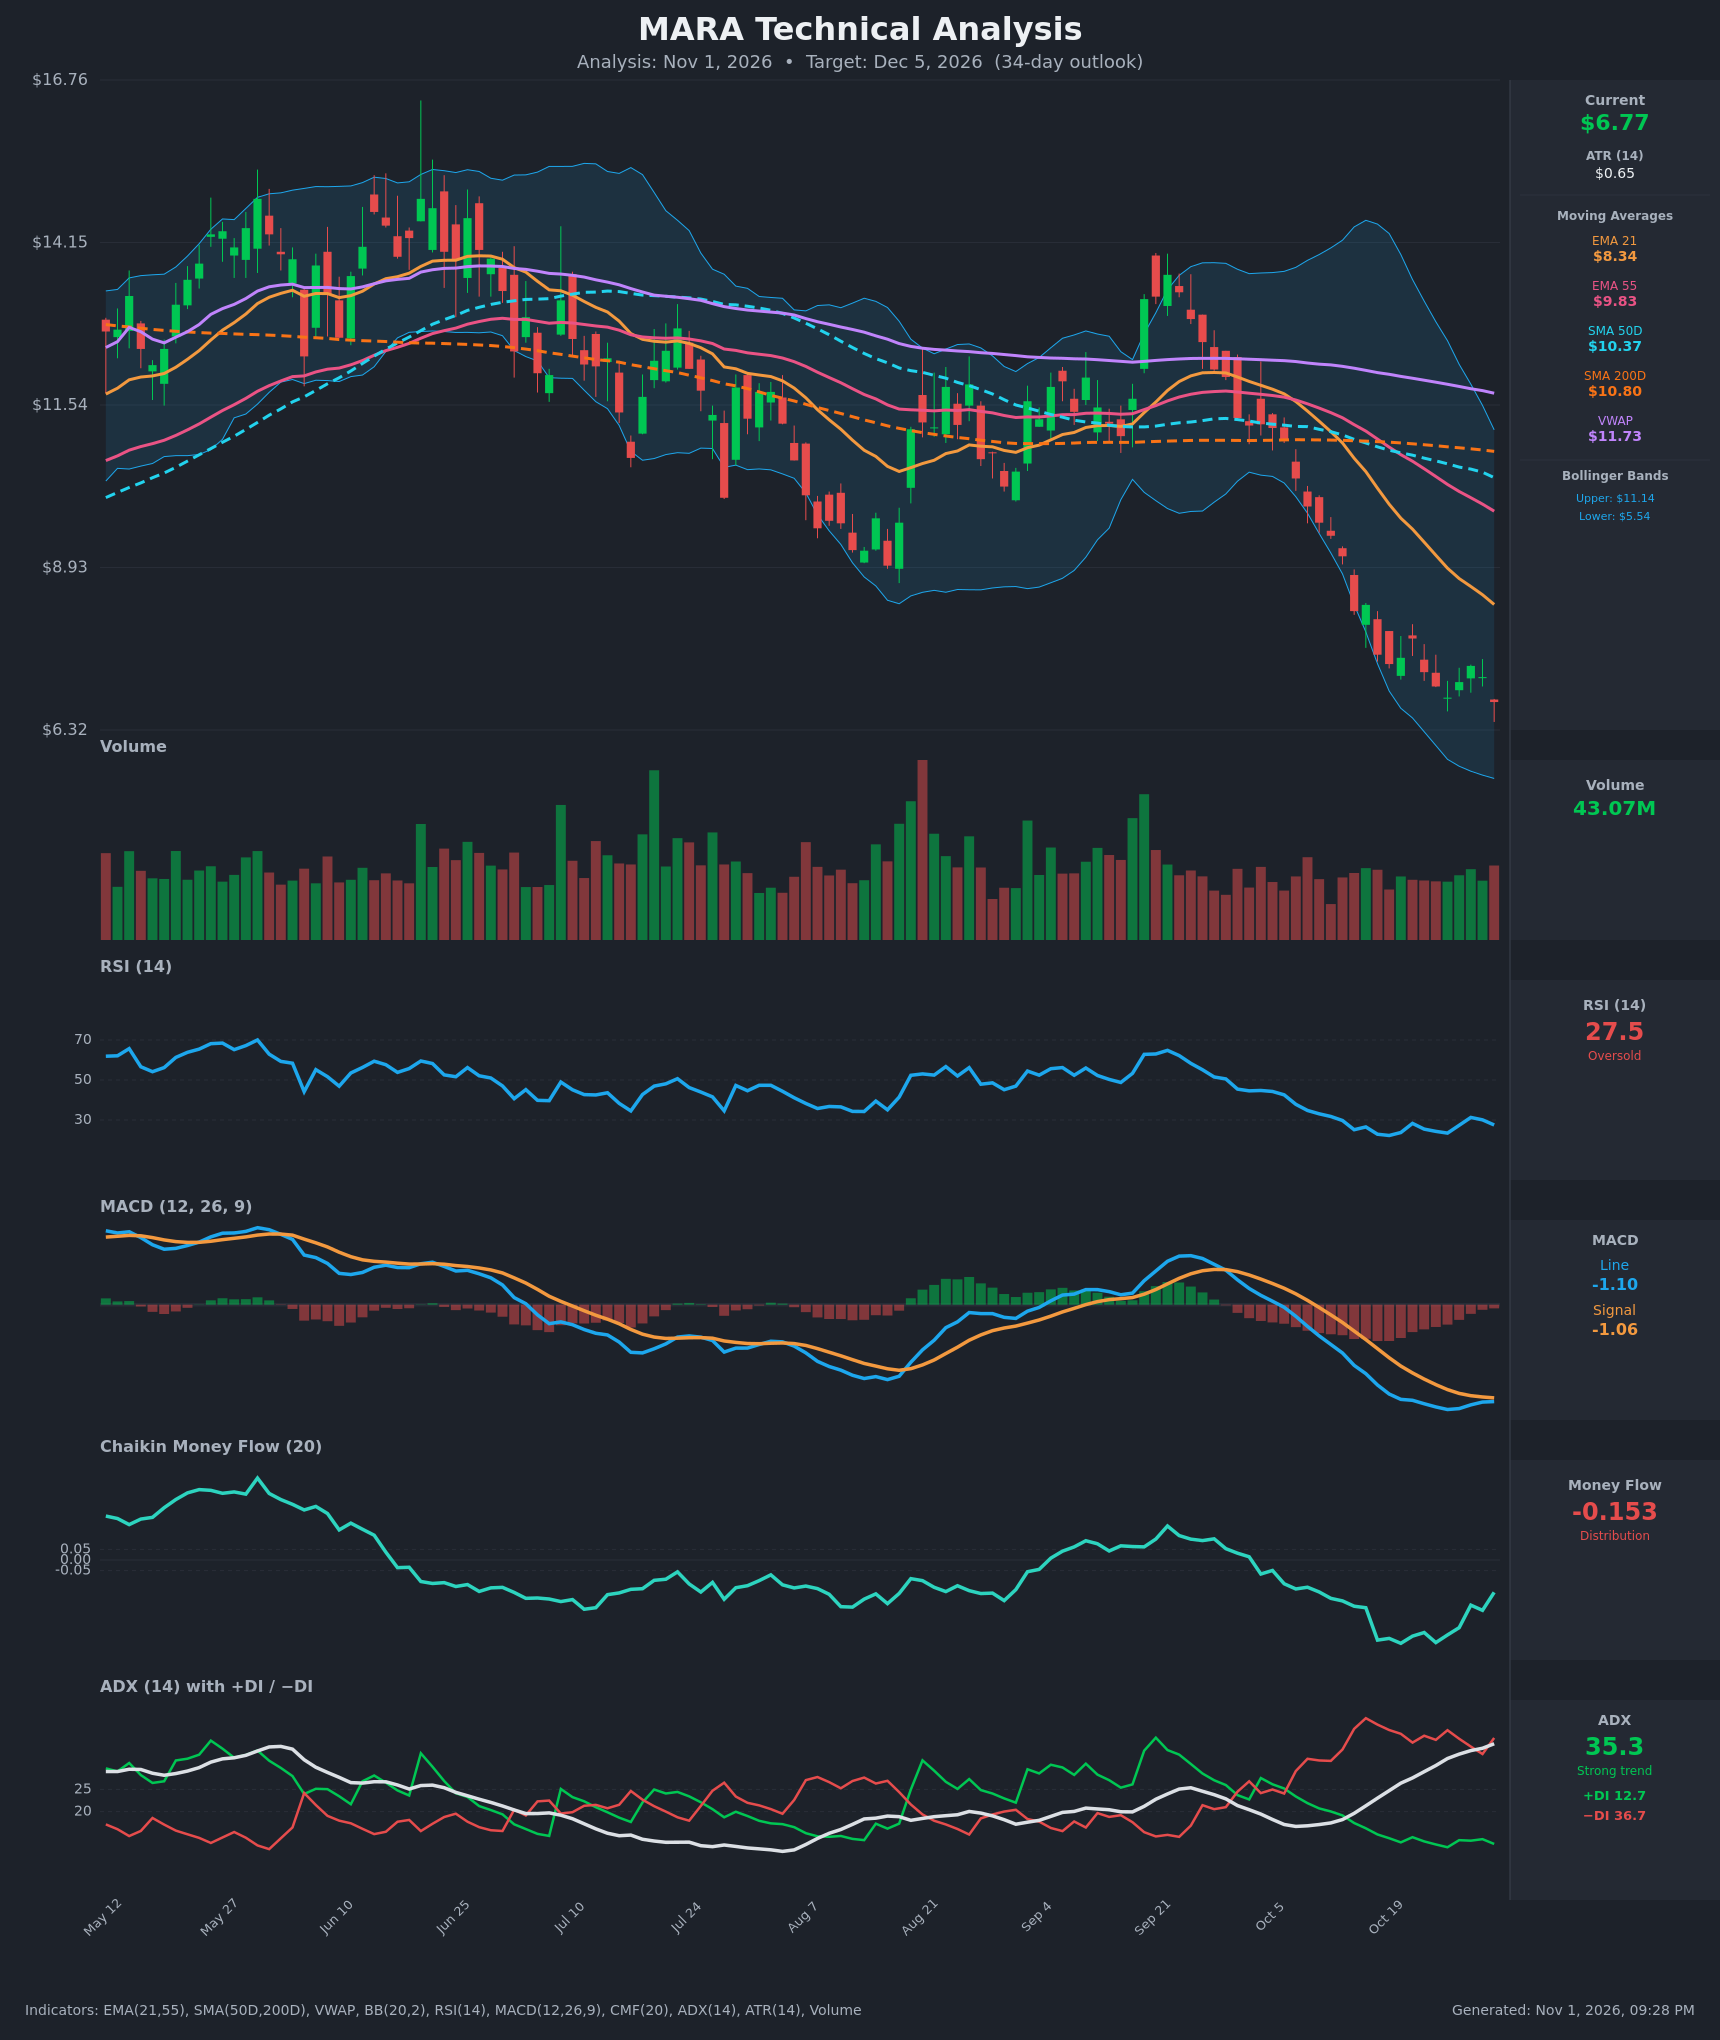
- RSI (14): 27.52, in oversold territory (<30). It has bounced from 22.3 on Oct 19 and made a lower high near 31 on Oct 28 before rolling over again. Oversold readings in a strong downtrend can persist, and momentum is still weak. [Bearish]
- 20 EMA: The EMA 21 is $8.34 and price at $6.77 is about 19% below it. The EMA 21 is falling steadily and is well above price, so it acts as overhead resistance. EMA 55 ($9.83) sits further above. [Bearish]
- MACD: The line is -1.098 and the signal is -1.057, so the line is still below the signal. The histogram is slightly negative (about -0.04) after narrowing from a deeper trough. Both lines are deeply negative, and a bullish cross is close but not confirmed. [Bearish]
- Bollinger Bands (20): Upper is $11.14 and lower is $5.54. Price at $6.77 is in the lower third of the bands, which are wide and expanding downward after a sharp selloff. Price has been riding the lower band, which is typical of a persistent downtrend. A bounce toward the midline (~$8.34) is possible, but the lower band remains the nearest magnet. [Bearish]
- CMF (20): -0.153, which is distribution. It has recovered from the lows near -0.39, so selling pressure is easing, but it is still well below -0.05. [Distribution]
- ADX (14): 35.3 and rising, so the trend is strong. -DI (36.7) is far above +DI (12.7), meaning the bears are firmly in control. [Strong Trend – Bearish]
- Volume: 43.07M, roughly average with no capitulation spike. The last red bar closed at new lows on steady volume. The lack of a washout volume surge suggests the selling may not be exhausted. [Neutral-to-Bearish]
DIVERGENCES & TRENDS
- Moving average structure: Price ($6.77) < EMA21 ($8.34) < EMA55 ($9.83) < SMA50D ($10.37) < SMA200D ($10.80) < VWAP ($11.73). This is a fully bearish stack. The SMA50D has been falling toward the SMA200D, and a death cross (SMA50D falling below SMA200D) is imminent. The EMA21 crossed below the EMA55 in October.
- RSI divergence: There is a mild bullish divergence. RSI made a higher low (~23.4 on Oct 26 vs 22.3 on Oct 19) while price made a lower low ($6.84 vs $7.38). It is a weak signal because the RSI has since rolled down again to 27.5 with price at a new low.
- MACD: The MACD line is flattening against the signal and could cross up, but it is deeply negative. Any cross would be a relief-rally signal, not a trend reversal.
- CMF: It improved from -0.39 to -0.15, a slight positive divergence, but it remains in distribution.
- ADX/DI: ADX is rising from 17 to 35 as -DI dominates. This is a classic strong-downtrend signature. A sustained decline from here would confirm the trend; an ADX turn lower would signal exhaustion.
CHART PATTERNS
- Bearish continuation / descending channel: Price has made a series of lower highs and lower lows since the September rejection near $14, and has now broken below the prior swing low of about $8.9 (Aug). This resembles a bearish continuation structure (a flag/pennant-like drift lower after the sharp Oct 12–16 drop). The Oct 19–30 consolidation between ~$6.8 and ~$7.8 is a small bearish flag. Its measured move (the pole of ~$9.4 to $7.4, about $2) would project toward $5.5.
- The $5.54 lower Bollinger Band lines up with that measured move and is the nearest downside target.
- Possible bullish reversal watch: A bullish falling wedge or double bottom would need a close back above ~$7.80 and then $8.30 (EMA21). That is not yet present.
POTENTIAL SCENARIOS
- Scenario 1: Bearish Trend Continuation — Price remains below all moving averages with -DI dominant and ADX above 30. The bear flag breaks lower with a likely death cross, driving price to the lower band area and below. Trigger: a daily close below ~$6.50 (the recent low). Target: $5.50–$5.80. Invalidation: a daily close above $7.80. (50% probability)
- Scenario 2: Bullish Oversold Relief Bounce — RSI is deeply oversold, CMF is recovering and MACD is near a bullish cross, which could spark a mean-reversion bounce toward the EMA21. Trigger: a close above $7.35–$7.80 with MACD crossing up. Target: $8.30–$8.40 (EMA21). Invalidation: a break below $6.30. (30% probability)
- Scenario 3: Neutral Basing Range — Price chops between ~$6.00 and $7.80 as selling exhausts and the ADX rolls over. Trigger: a series of inside closes within the range. Target: $6.60–$7.30. Invalidation: a close outside $6.00–$7.80. (20% probability)
PRICE TARGETS
For a 34-day horizon (guidance ~12–18% range width), the ATR of $0.65 implies a daily volatility of roughly 9.6%, so a wider range is warranted. Sizing for a 34-day move gives a width of about $2.50 (~37%) if purely volatility-based, but I am anchoring toward the upper end of the guided band at about 18%, adjusted slightly higher for the elevated ATR.
- Target Price: $6.10 (the bias is for continued downside toward the lower band, with a partial bounce along the way)
- Expected Range: $5.20 to $7.50 (width $2.30 ≈ 34% of current price; wider than the standard 12–18% guidance because the ATR is ~9.6% of price and the stock is in a high-volatility trend)
- Key Levels: Support at $5.54 (lower Bollinger Band), Resistance at $7.80 (recent bounce high / bear-flag top)
OVERALL BIAS
OVERALL BIAS: BEARISH - Price sits below every moving average with ADX 35 and -DI far above +DI, CMF in distribution and MACD still below its signal. Oversold RSI raises the chance of a relief bounce, but the trend and the lack of a capitulation signal favor further downside toward the lower band near $5.54.
This is educational analysis and not financial advice.