EEM 34-day bearish forecast — Nov 1, 2026
- Bias: Bearish
- Timeframe: 34 days (made Nov 1, 2026, target date Dec 4, 2026)
- Price at analysis: $61.04
- Price target: $59.80
- Expected range: $55.50 – $64.50
- Result: Pending — graded after the close on Dec 4, 2026
Get a free AI analysis of EEM today
Analysis
TECHNICAL INDICATORS
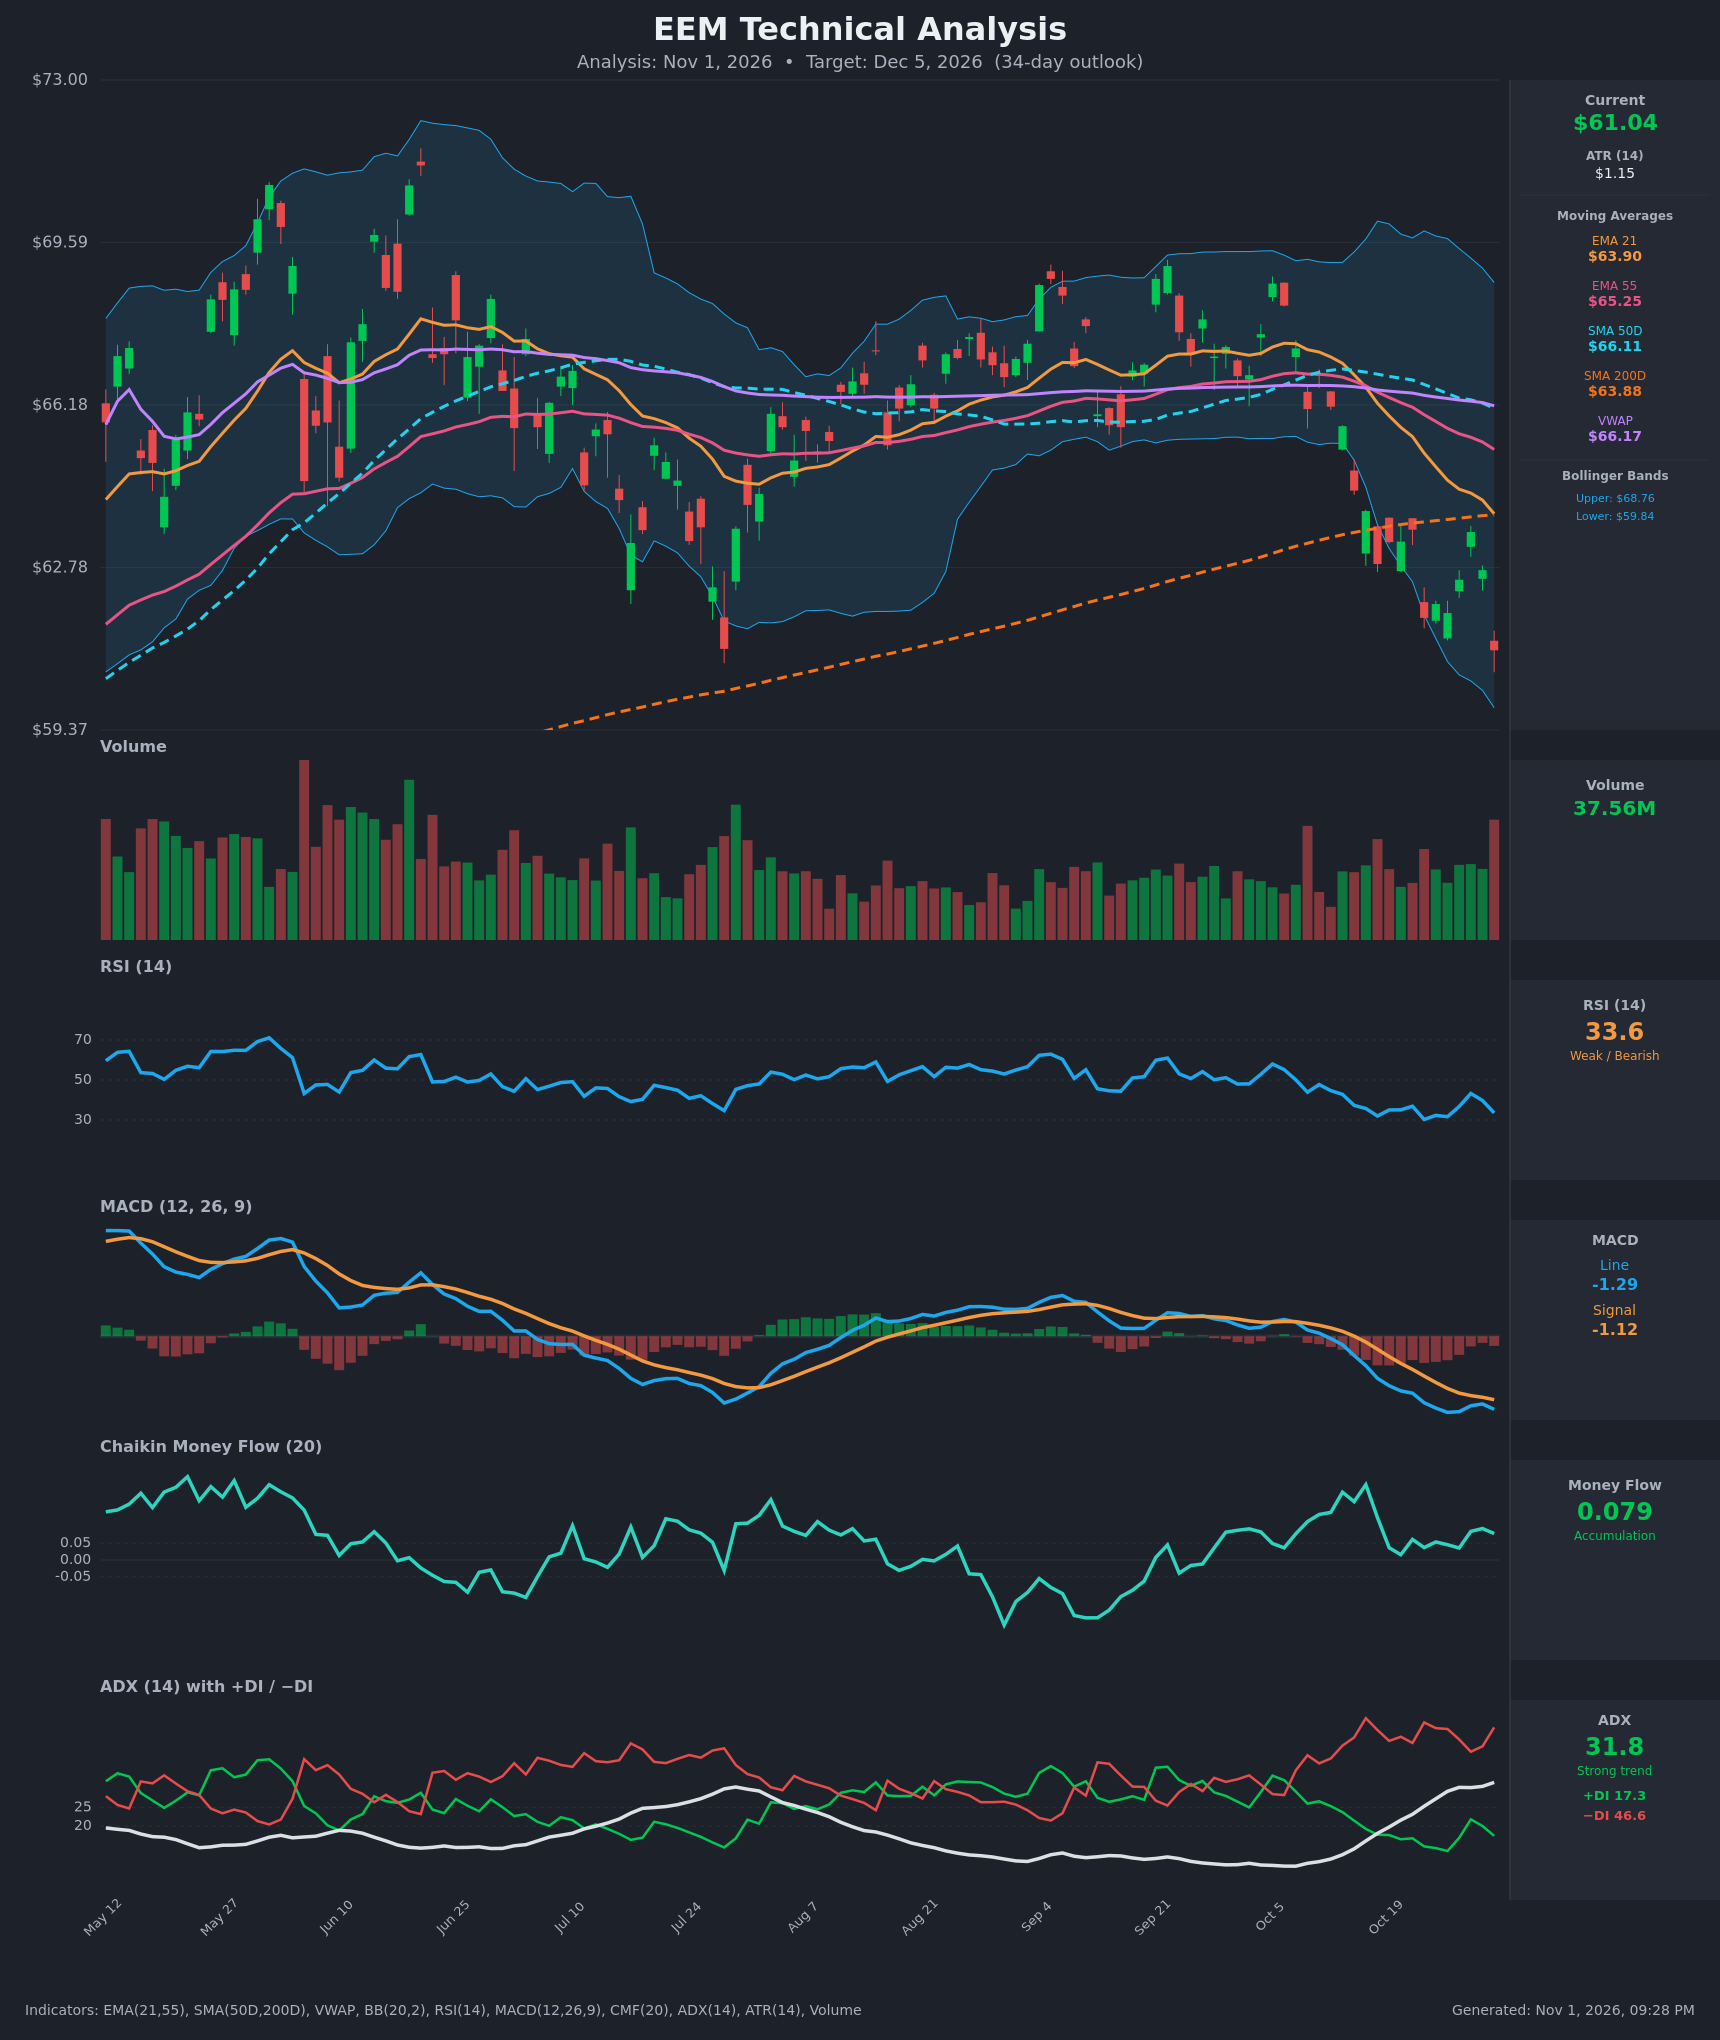
- RSI (14): 33.56, just above oversold (30) after bouncing from 30.3 on Oct 22 and 43.3 on Oct 28, then rolling over again. Momentum is weak and lower highs on each bounce show sellers still in control, though a drop under 30 would be a stretched, bounce-prone reading. [Bearish]
- 20 EMA: The chart uses EMA 21 at $63.90. Price at $61.04 is about 4.5% below it, and the EMA is sloping down. EMA 55 ($65.25) is also overhead, and the EMA21 has been below EMA55 since mid-October. The EMA21 is now resistance. [Bearish]
- MACD: Line -1.29 is below signal -1.12, with a negative and widening histogram. The Oct 28 bounce briefly narrowed the gap, but the line has turned down again, so there is no bullish crossover. [Bearish]
- Bollinger Bands (20): Upper $68.76, lower $59.84. Price at $61.04 sits in the lower quarter of the bands, about $1.20 (roughly one ATR) above the lower band. The bands are expanding downward, which confirms a volatility-driven downtrend. A "walk the band" move is possible, though price is stretched enough that a mean-reversion bounce toward the $63–64 midline is also plausible. [Bearish]
- CMF (20): +0.079, above the +0.05 threshold and positive throughout the decline. This is a notable divergence, since money flow is holding up while price falls. It hints at dip-buying, but the reading is modest. [Accumulation]
- ADX (14): 31.8 and rising, with −DI (46.6) far above +DI (17.3). ADX has climbed from about 11 to 32 in under three weeks. This is a strong, established downtrend with bears firmly in control. [Strong Trend – Bearish]
- Volume: 37.56M, with the latest bar red and among the heavier recent sessions. Selling volume is expanding on the break below the SMA200, which supports the downtrend. [Bearish – distribution on breakdown]
DIVERGENCES & TRENDS
- Bullish divergence (CMF vs price): CMF is positive (+0.079) while price makes lower lows, which suggests some accumulation. RSI has not made a clear higher low (30.3 → 31.7 → 33.6 on a lower price), so this is only partial confirmation.
- Moving averages: Price is below the EMA21, EMA55, SMA50D ($66.11), and VWAP ($66.17). It also broke below the SMA200D ($63.88) around Oct 22, which turns the long-term trend signal bearish. EMA21 crossed below EMA55 around Oct 15. SMA50D remains above SMA200D, so there is no death cross yet, but the two are converging and the SMA50D is rolling over.
- MACD: It has been below signal since before Oct 12, and the gap widened from -0.04 to -1.29. The bounce attempt on Oct 28 failed.
- DI and ADX: −DI has been above +DI throughout, and ADX is rising through 25 and 30. This confirms trend acceleration.
- Price vs VWAP: Price is about 7.8% below VWAP, a stretched condition. Rebounds may stall in the $63–64 zone.
- Support test: Price is retesting the July swing low area (~$60.5–61), the key horizontal support. The decision point is here.
CHART PATTERNS
- Bearish continuation (bearish flag / pennant): The decline from ~$66 to $61 with a brief rebound to $63.52 on Oct 28 resembles a small bearish flag. A breakdown below $60.50 targets roughly $57.50–58.50, based on the flag-pole measure.
- Breakdown from consolidation: Price lost the $62.5–63 area and the SMA200D after a long range between about $61 and $69. This is a bearish break of structure.
- Potential Bullish Double Bottom: The July low (~$60.5–61) is being retested. A hold followed by a close above the $63.5 neckline (also the SMA200D) would target about $66, but this is not confirmed. A decisive close below $60 would invalidate it and open a measured move to the mid-to-high $50s.
POTENTIAL SCENARIOS
- Scenario 1: Bearish Trend Continuation — Strong ADX and −DI dominance, a MACD below signal, and a break under the SMA200D favor a break of the July low and a push through the lower Bollinger Band. Trigger: daily close below $60.50 (July lows/lower band $59.84) on rising volume. Target: $57.50–$58.50, with an expected 34-day close near $59.80. Invalidation: daily close above $63.90 (EMA21/SMA200D zone). (47% probability)
- Scenario 2: Bullish Double-Bottom Rebound — Support holds at the July lows, RSI turns up from near 30, and the positive CMF confirms dip buying, leading to a mean-reversion bounce. Trigger: close above $62.80, then above $63.90. Target: $64.00–$65.25 (EMA21 to EMA55), with an extension to $66 if the neckline breaks. Invalidation: close below $59.80. (38% probability)
- Scenario 3: Neutral Choppy Base — Price oscillates between ~$59.50 and ~$63.50 as selling exhausts but buyers cannot reclaim the SMA200D. Trigger: ADX rolls over from ~32 and price stays inside the range. Target: $60.50–$62.50. Invalidation: close outside $59.50–$63.90. (15% probability)
PRICE TARGETS
- Target Price: $59.80 (34-day)
- Expected Range: $55.50 to $64.50 (width $9.00 ≈ 14.7% of current price, in line with the 30–60 day guidance)
- Key Levels: Support at $59.84 (lower Bollinger Band, near July lows ~$60.5), Resistance at $63.88 (SMA200D, with EMA21 at $63.90)
OVERALL BIAS
OVERALL BIAS: BEARISH - A strong, accelerating downtrend (ADX 31.8, −DI 46.6 vs +DI 17.3), a MACD below signal, and a break below the SMA200D and all other moving averages outweigh the oversold-ish RSI (33.6) and positive CMF. A rebound toward $63–64 is a real risk if the July low holds, but trend evidence favors a further push lower.
This is educational analysis and not financial advice.