NIO 34-day bearish forecast — Nov 1, 2026
- Bias: Bearish
- Timeframe: 34 days (made Nov 1, 2026, target date Dec 4, 2026)
- Price at analysis: $3.21
- Price target: $3.05
- Expected range: $2.65 – $3.55
- Result: Pending — graded after the close on Dec 4, 2026
Get a free AI analysis of NIO today
Analysis
TECHNICAL INDICATORS
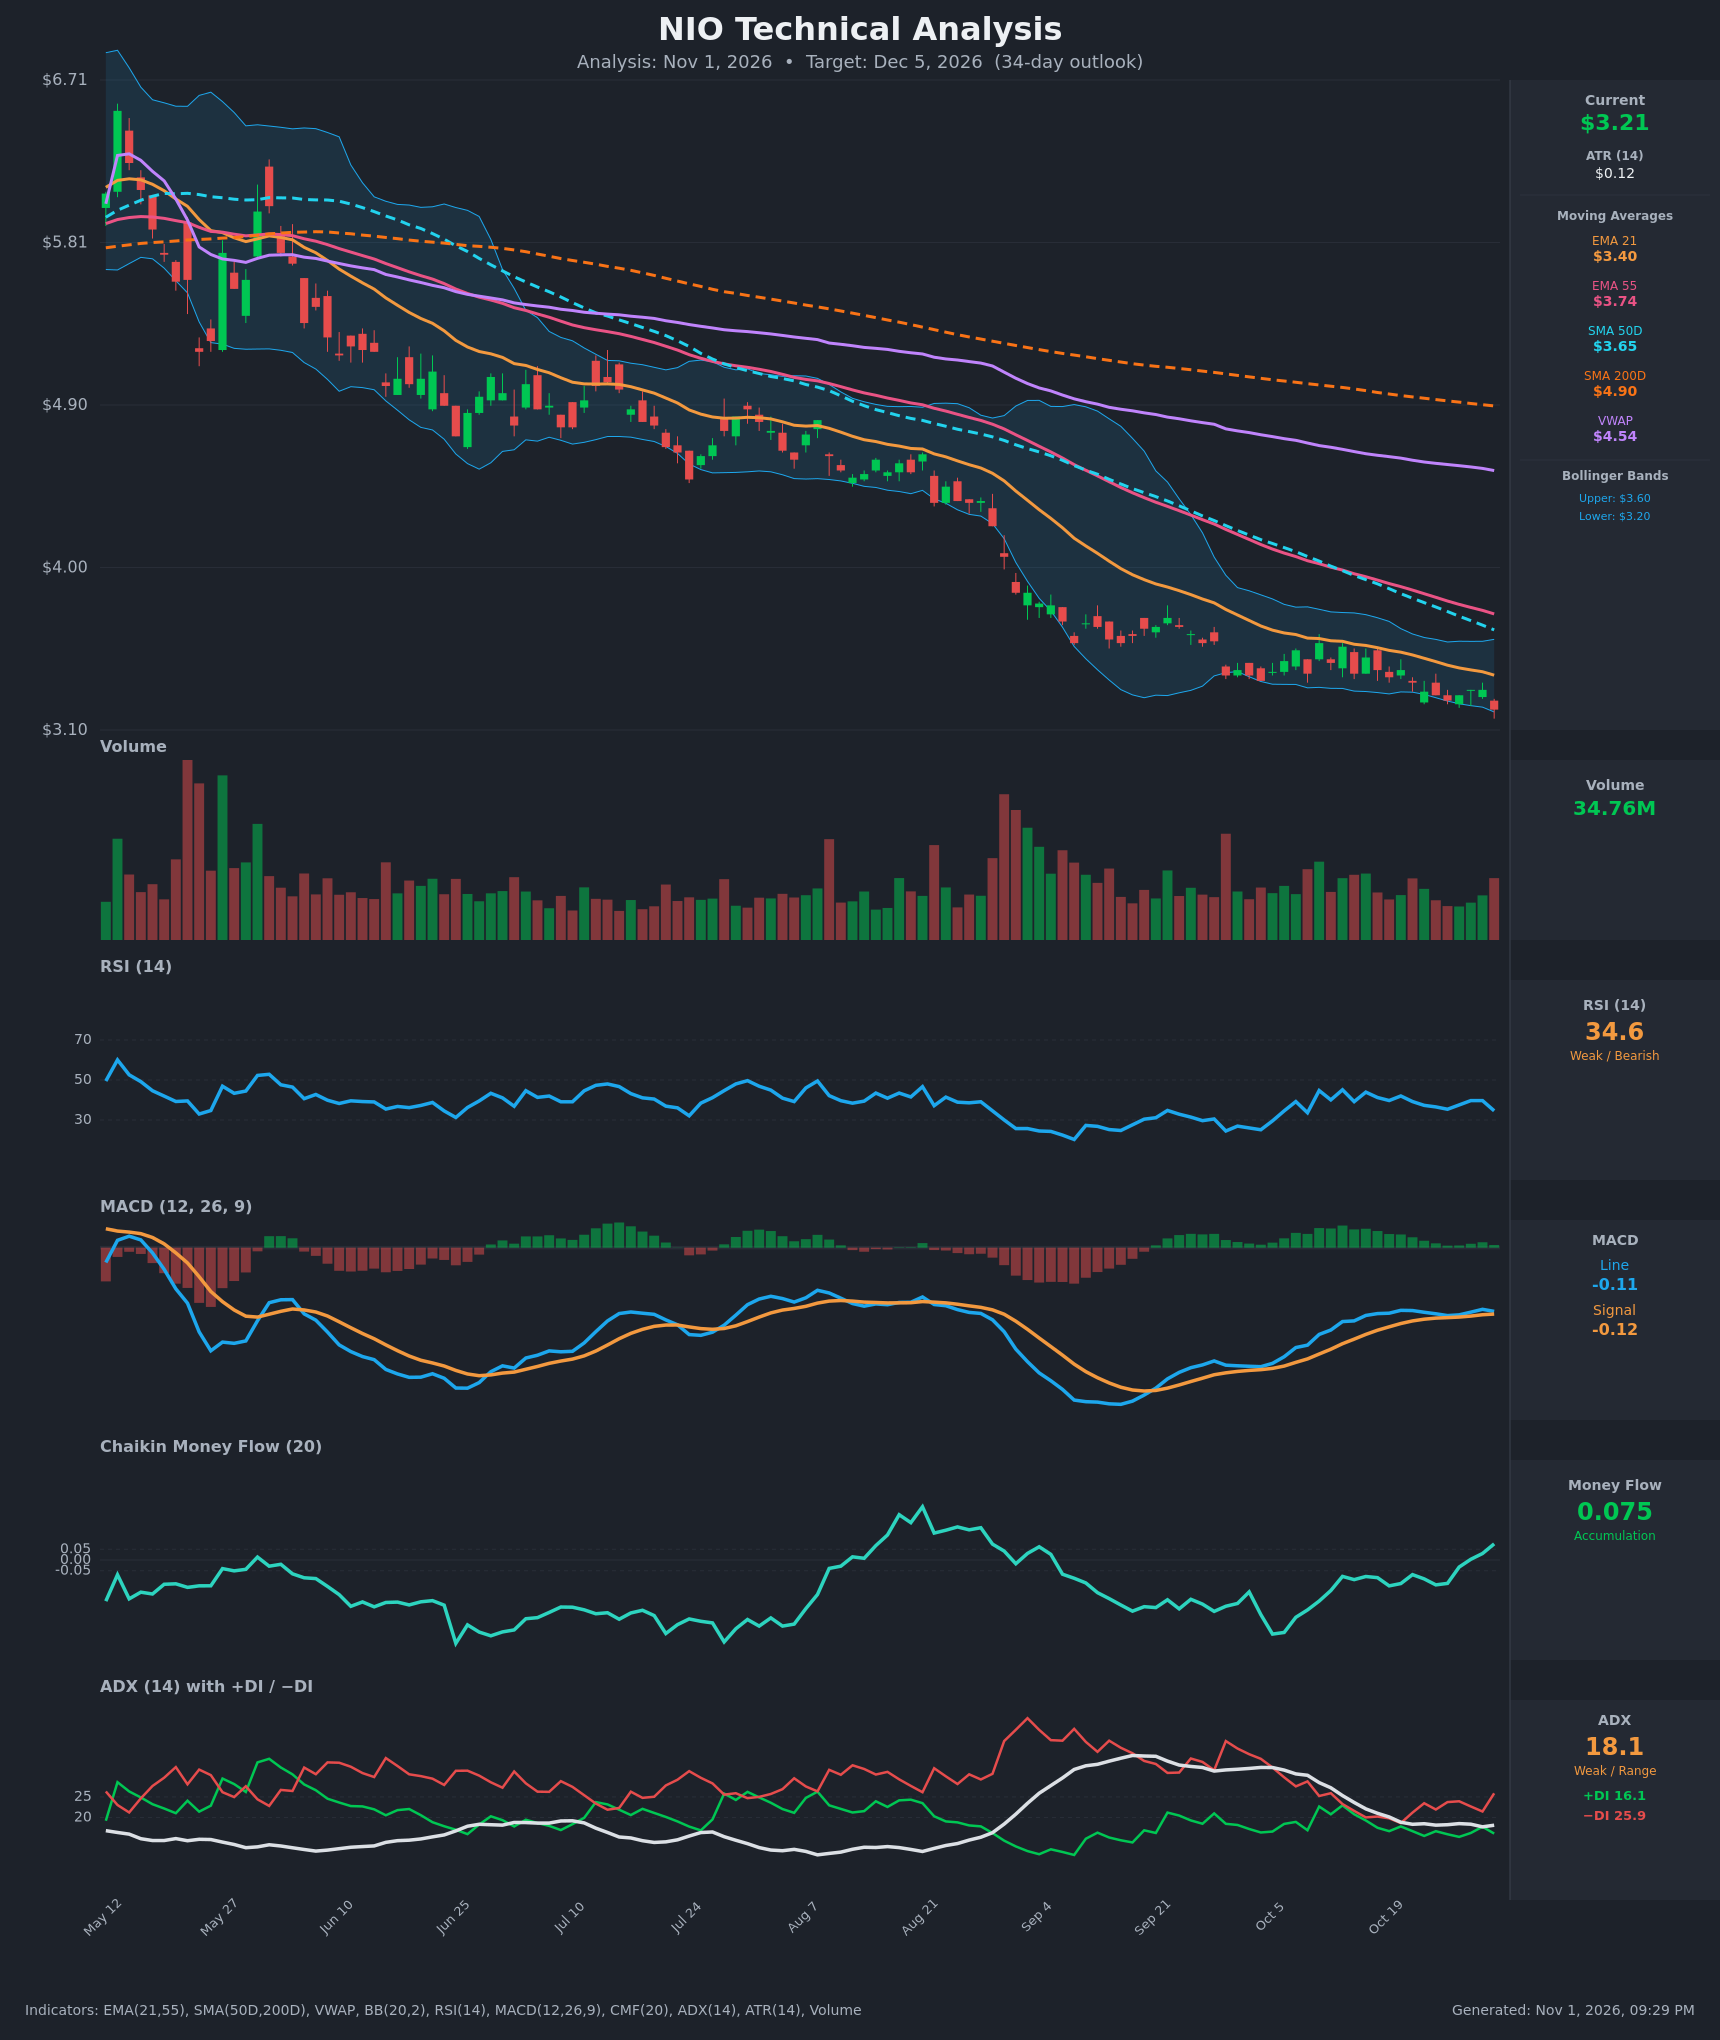
- RSI (14): 34.60, near the oversold line but not yet below 30. It has stayed in a 35–45 band for weeks and just rolled down from 39.7 to 34.6 on the latest red bar. Momentum is weak but not capitulating. [Bearish]
- 20 EMA: The 21 EMA is $3.40 and price at $3.21 is about 5.6% below it. The EMA is sloping down and has acted as resistance on every bounce since early October. EMA21 ($3.40) is also below EMA55 ($3.74), so the bearish stack is intact. [Bearish]
- MACD: Line -0.112 and signal -0.117, so the line is just above the signal and the histogram is barely positive. The line is flat at about -0.11 and has not gained any positive momentum. This is a marginal, weak bullish cross in a downtrend, and it is not confirmed by price. [Neutral]
- Bollinger Bands (20): Upper $3.60 and lower $3.197, with price at $3.21 hugging the lower band. The bands are narrowing, so volatility is compressing. Price walking the lower band is a bearish trend behavior. A bounce toward the midline (about $3.40, near the EMA21) is possible, but a close below the band would extend the downside. [Bearish]
- CMF (20): 0.075 and rising from -0.12 in mid-October, now above the +0.05 threshold. Buying pressure is picking up while price makes new lows, which is a positive divergence. [Accumulation]
- ADX (14): 18.1 with -DI (25.9) above +DI (16.1). The trend is weak, below 20, and has faded from 27 as the decline slowed. Bears still control direction, but there is little trend strength behind the move. [Weak Trend, bearish lean]
- Volume: 34.76M, roughly average with no capitulation spike. Recent sessions show small candles on moderate volume, which signals a slow grind lower rather than panic selling. Volume spikes are absent, so there is no exhaustion signal yet. [Neutral / no capitulation]
DIVERGENCES & TRENDS
- Positive CMF divergence: CMF has climbed from about -0.12 to +0.075 while price made lower lows ($3.39 to $3.21). This points to accumulation near the lows.
- RSI/MACD: RSI made a higher low in early October relative to the August trough (about 25), so there is a mild bullish momentum divergence versus the August capitulation. The MACD line is flat near -0.11 rather than falling. Even so, RSI is rolling over again.
- Moving averages: Price is below the EMA21 ($3.40), EMA55 ($3.74), SMA50 ($3.65), SMA200 ($4.90) and VWAP ($4.54). The SMA50 is well below the SMA200, so the death cross is long established. All averages slope down.
- DI: -DI crossed back above +DI on Oct 30 (25.9 vs 16.1). Bears are back in control after the brief near-convergence on Oct 29.
- Trend: The decline from $6.70 in May is a persistent downtrend with lower highs and lower lows. The ADX of 18 suggests it has slowed into a drift.
CHART PATTERNS
- Bearish continuation / Bearish Flag-like drift: After the sharp drop in September from about $4.00 to $3.50, price has meandered slightly down in a tight channel. This resembles the Bearish Flag/Pennant from the reference. The measured move from the September leg (about $0.60 to $0.80) would project toward $2.70–$2.90 on a breakdown below roughly $3.20.
- Possible Bullish Falling Wedge: Price compression along the lower band with declining volatility, plus CMF accumulation, gives a partial falling-wedge look. It is not confirmed without a breakout above the EMA21 ($3.40).
- Because price is below the lower band and all averages, the bearish continuation reading carries more weight, and the bullish wedge is a lower-probability alternative.
POTENTIAL SCENARIOS
- Scenario 1: Bearish Continuation Lower — The downtrend persists, with price breaking below the $3.20 support and the lower Bollinger Band, and bears (-DI) staying in control. Trigger: daily close below $3.19 on rising volume. Target: $2.90–$3.00, with an extension to $2.75. Invalidation: close above $3.40 (EMA21). (50% probability)
- Scenario 2: Neutral Base and Range — Price stabilizes between $3.00 and $3.45 as CMF accumulation offsets weak momentum. Trigger: holding $3.10–$3.20 with RSI staying 30–45. Target: $3.20–$3.40. Invalidation: close below $3.00 or above $3.60. (22% probability)
- Scenario 3: Bullish Mean-Reversion Bounce — The positive CMF divergence and lower-band contact drive a relief rally toward the middle band and the declining moving averages. Trigger: close above $3.40 with MACD turning positive. Target: $3.60–$3.75 (SMA50/EMA55). Invalidation: close below $3.10. (28% probability)
PRICE TARGETS
- Target Price: $3.05 (34-day)
- Expected Range: $2.65 to $3.55. The width is $0.90, or about 28% of the current price. This is wider than the 12–18% guidance for 30–60 days because NIO's ATR is about 3.8% of price (daily) and the stock sits at multi-month lows. A shorter but still wide range is also justified by the compressing bands, which tend to resolve sharply.
- Key Levels: Support at $3.00 (psychological, then $2.75), Resistance at $3.40 (EMA21; the next resistance is $3.65–$3.75 at the SMA50/EMA55)
OVERALL BIAS
OVERALL BIAS: BEARISH - Price is below every moving average and VWAP, hugging the lower Bollinger Band with -DI above +DI, and the death-cross structure is intact. The CMF accumulation and flat MACD temper the conviction, so the expected drift is modest rather than a collapse.
This is educational analysis and not financial advice.