ARM 34-day bearish forecast — Nov 1, 2026
- Bias: Bearish
- Timeframe: 34 days (made Nov 1, 2026, target date Dec 4, 2026)
- Price at analysis: $205.97
- Price target: $194.00
- Expected range: $176.00 – $212.00
- Result: Pending — graded after the close on Dec 4, 2026
Get a free AI analysis of ARM today
Analysis
TECHNICAL INDICATORS
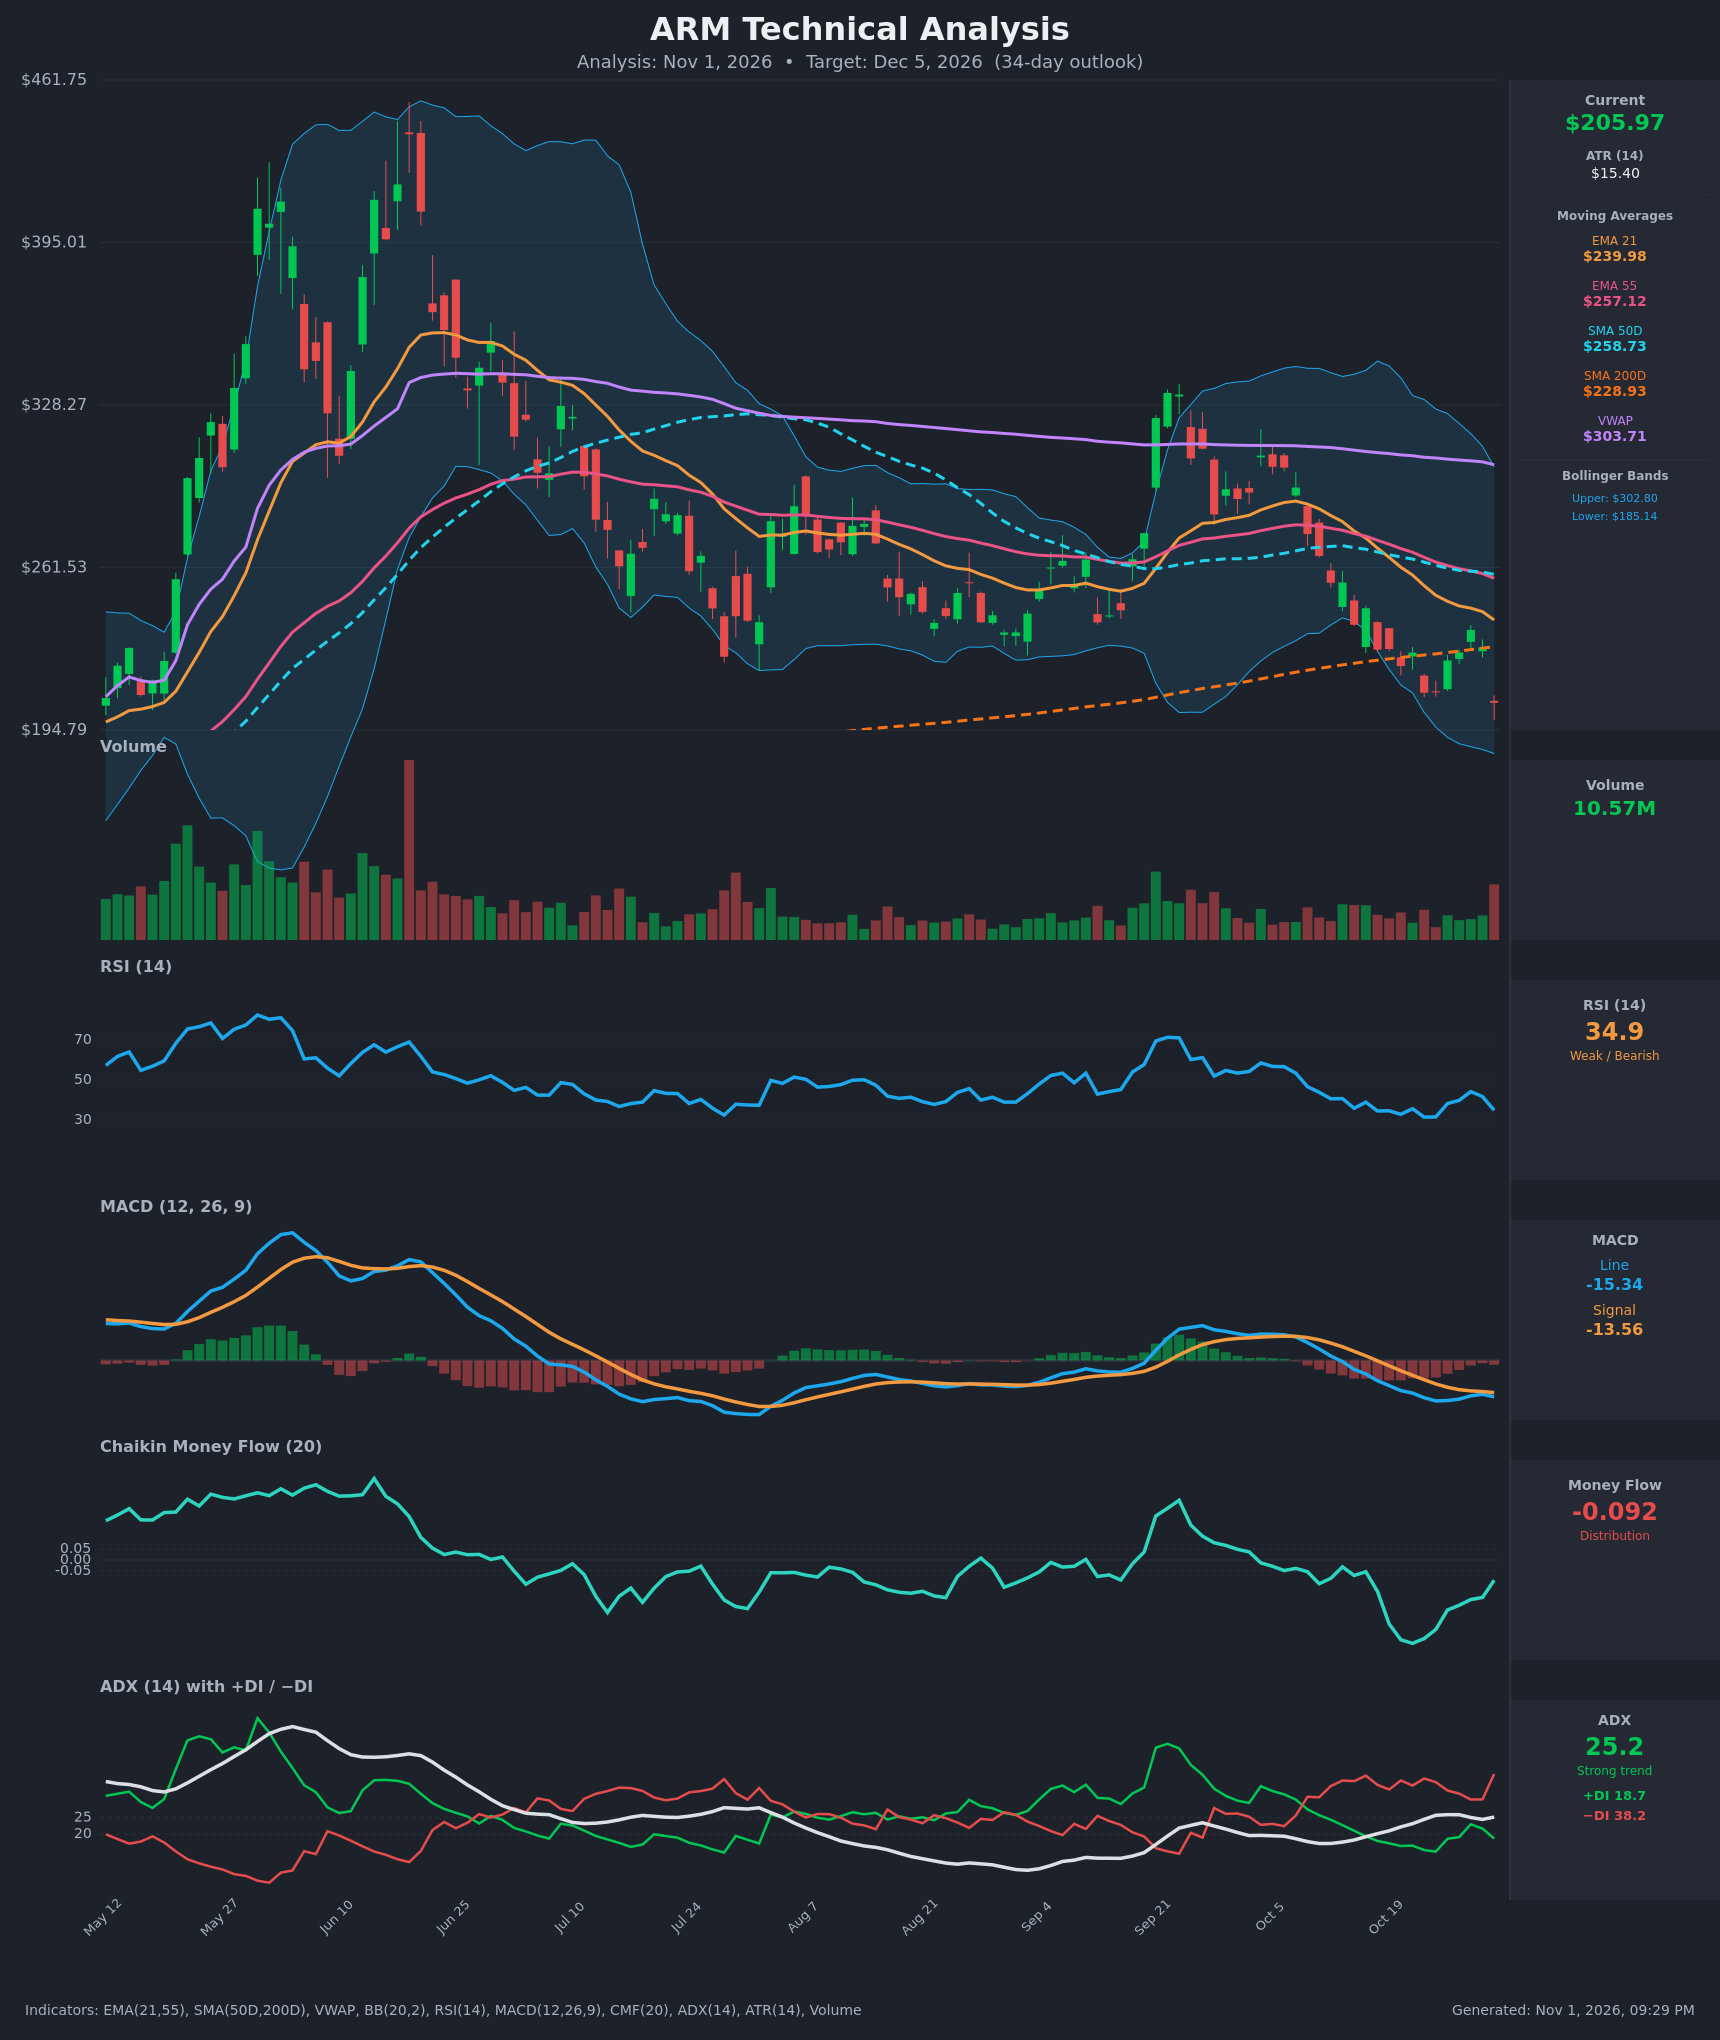
- RSI (14): 34.86, close to oversold (<30) but not there yet. It has made lower highs since the Sep 21 peak, and the last drop from 41.7 to 34.9 shows momentum rolling over again. The prior RSI lows near 31 came with price near $210, so a bounce is possible, but the trend is down. [Bearish]
- 20 EMA: The chart shows EMA 21 at $239.98, with EMA 55 at $257.12. Price at $205.97 is about 14% below the EMA 21, which is now overhead resistance and falling steeply. EMA 21 crossed below EMA 55 around Oct 15, a bearish crossover. [Bearish]
- MACD: Line -15.35 is below signal -13.56, and the histogram is about -1.8 and widening again after briefly narrowing. Both lines are below zero and turning down, so there is no bullish crossover yet. [Bearish]
- Bollinger Bands (20): Upper $302.80, lower $185.14, midline about $244. Price is in the lower third of the band and below the midline. The bands are wide from the earlier volatility and are now pointing down. The big -10% candle on Oct 30 is pushing toward the lower band, which is the next support. A tag of the lower band could bring a short-term bounce, but the trend is "walking the band" down. [Bearish]
- CMF (20): -0.092, below the -0.05 threshold. It sank to about -0.38 on Oct 21, recovered to -0.09, and is still negative, which means persistent distribution. Rallies have been sold. [Distribution]
- ADX (14): 25.2, just above the 25 trend threshold. −DI is 38.2 against +DI 18.7, a wide gap, and −DI jumped from 30.5 on Oct 29. Bears are firmly in control and the trend is strengthening. [Strong Trend – Bearish]
- Volume: 10.57M on the Oct 30 sell-off, a visible uptick versus the very light volume of recent weeks. A -10% day on rising volume signals real selling and confirms the breakdown, though it could also mark a capitulation attempt. [Bearish – selling pressure]
DIVERGENCES & TRENDS
- Moving-average structure: Price ($205.97) is below EMA 21, EMA 55, SMA 50D ($258.73) and SMA 200D ($228.93). The close below the SMA 200D is a long-term trend break, and the failed retest of it on Oct 26–29 (highs near $235) confirms it as resistance.
- Death cross risk: SMA 50D is still above SMA 200D, but the gap has narrowed from about $50 to about $30 in two weeks. A death cross is plausible within the 34-day window.
- No bullish divergence: RSI and MACD made lower lows alongside price, so there is no divergence to support a reversal. RSI at 34.9 is above its Oct 22–23 low of 31.4 while price is lower ($205.97 vs $210.10). This is a mild bullish divergence, but it is weak and unconfirmed.
- VWAP: Price is far below VWAP ($303.71), which shows sustained selling pressure relative to the average cost basis.
- DI and ADX: −DI has been above +DI for the whole period shown, and ADX is turning up from the low-20s, so the downtrend is gaining strength.
- Lower highs: Peaks run $330 (Sep 21), then about $290, then about $235, a clear staircase down.
CHART PATTERNS
- Bearish Descending Triangle: Price stalled near $210 (the Oct 22–23 lows) while the highs kept falling, and the Oct 30 close at $205.97 breaks that flat support. The measured move (about $45 of height) would point toward $165, which is an extended target and not the base case for 34 days.
- Bearish Flag/Channel: The Oct 26–29 bounce into the SMA 200D and EMA 21 was a corrective rally within a downtrend, and it was rejected. This supports continuation lower.
- Broader context: The June peak near $440 followed by a lower-high sequence is a long distribution structure. The failed attempt to reclaim the $330 area in September was a bearish lower high.
POTENTIAL SCENARIOS
- Scenario 1: Bearish Breakdown Continuation — The descending triangle breakdown and a close below the SMA 200D lead to another leg lower, with the lower Bollinger Band as the first stop. Trigger: sustained closes below $205 and below the Oct 23 low of about $210; MACD stays below signal and −DI stays above 35. Target: $185 first, then $175–$180. Invalidation: daily close back above $229 (SMA 200D). (55% probability)
- Scenario 2: Bullish Oversold Relief Bounce — RSI nears 30, price tags the lower band, and short covering lifts it back toward the SMA 200D and EMA 21 before sellers return. Trigger: hold above $195–$200 with a rising RSI and a CMF move above -0.05. Target: $225–$230, with resistance near $240 (EMA 21). Invalidation: close below $185. (30% probability)
- Scenario 3: Neutral Range Consolidation — A basing range forms between about $185 and $225 as volatility compresses and ADX fades. Trigger: low-volume chop with ADX falling below 22. Target: $195–$215. Invalidation: close outside the range on volume. (15% probability)
PRICE TARGETS
Timeframe: 34 days, so the range is about 12–18% of the current price. Self-check: the width is $212.00 − $176.00 = $36.00, which is 17.5% of $205.97 and fits the guidance.
- Target Price: $194.00 (34 days, bearish drift with a partial bounce risk)
- Expected Range: $176.00 to $212.00
- Key Levels: Support at $185.14 (lower Bollinger Band), Resistance at $228.93 (SMA 200D)
OVERALL BIAS
OVERALL BIAS: BEARISH - Price has broken below the SMA 200D and every key moving average, MACD is below signal, −DI dominates (38.2 vs 18.7) with ADX rising through 25, and CMF shows persistent distribution. Oversold conditions (RSI 34.9, price nearing the lower Bollinger Band) argue for a possible relief bounce, but the evidence favors continuation lower toward $185 and below.
This is educational analysis and not financial advice.