PFE 34-day bullish forecast — Nov 1, 2026
- Bias: Bullish
- Timeframe: 34 days (made Nov 1, 2026, target date Dec 4, 2026)
- Price at analysis: $30.52
- Price target: $31.70
- Expected range: $28.80 – $33.40
- Result: Pending — graded after the close on Dec 4, 2026
Get a free AI analysis of PFE today
Analysis
TECHNICAL INDICATORS
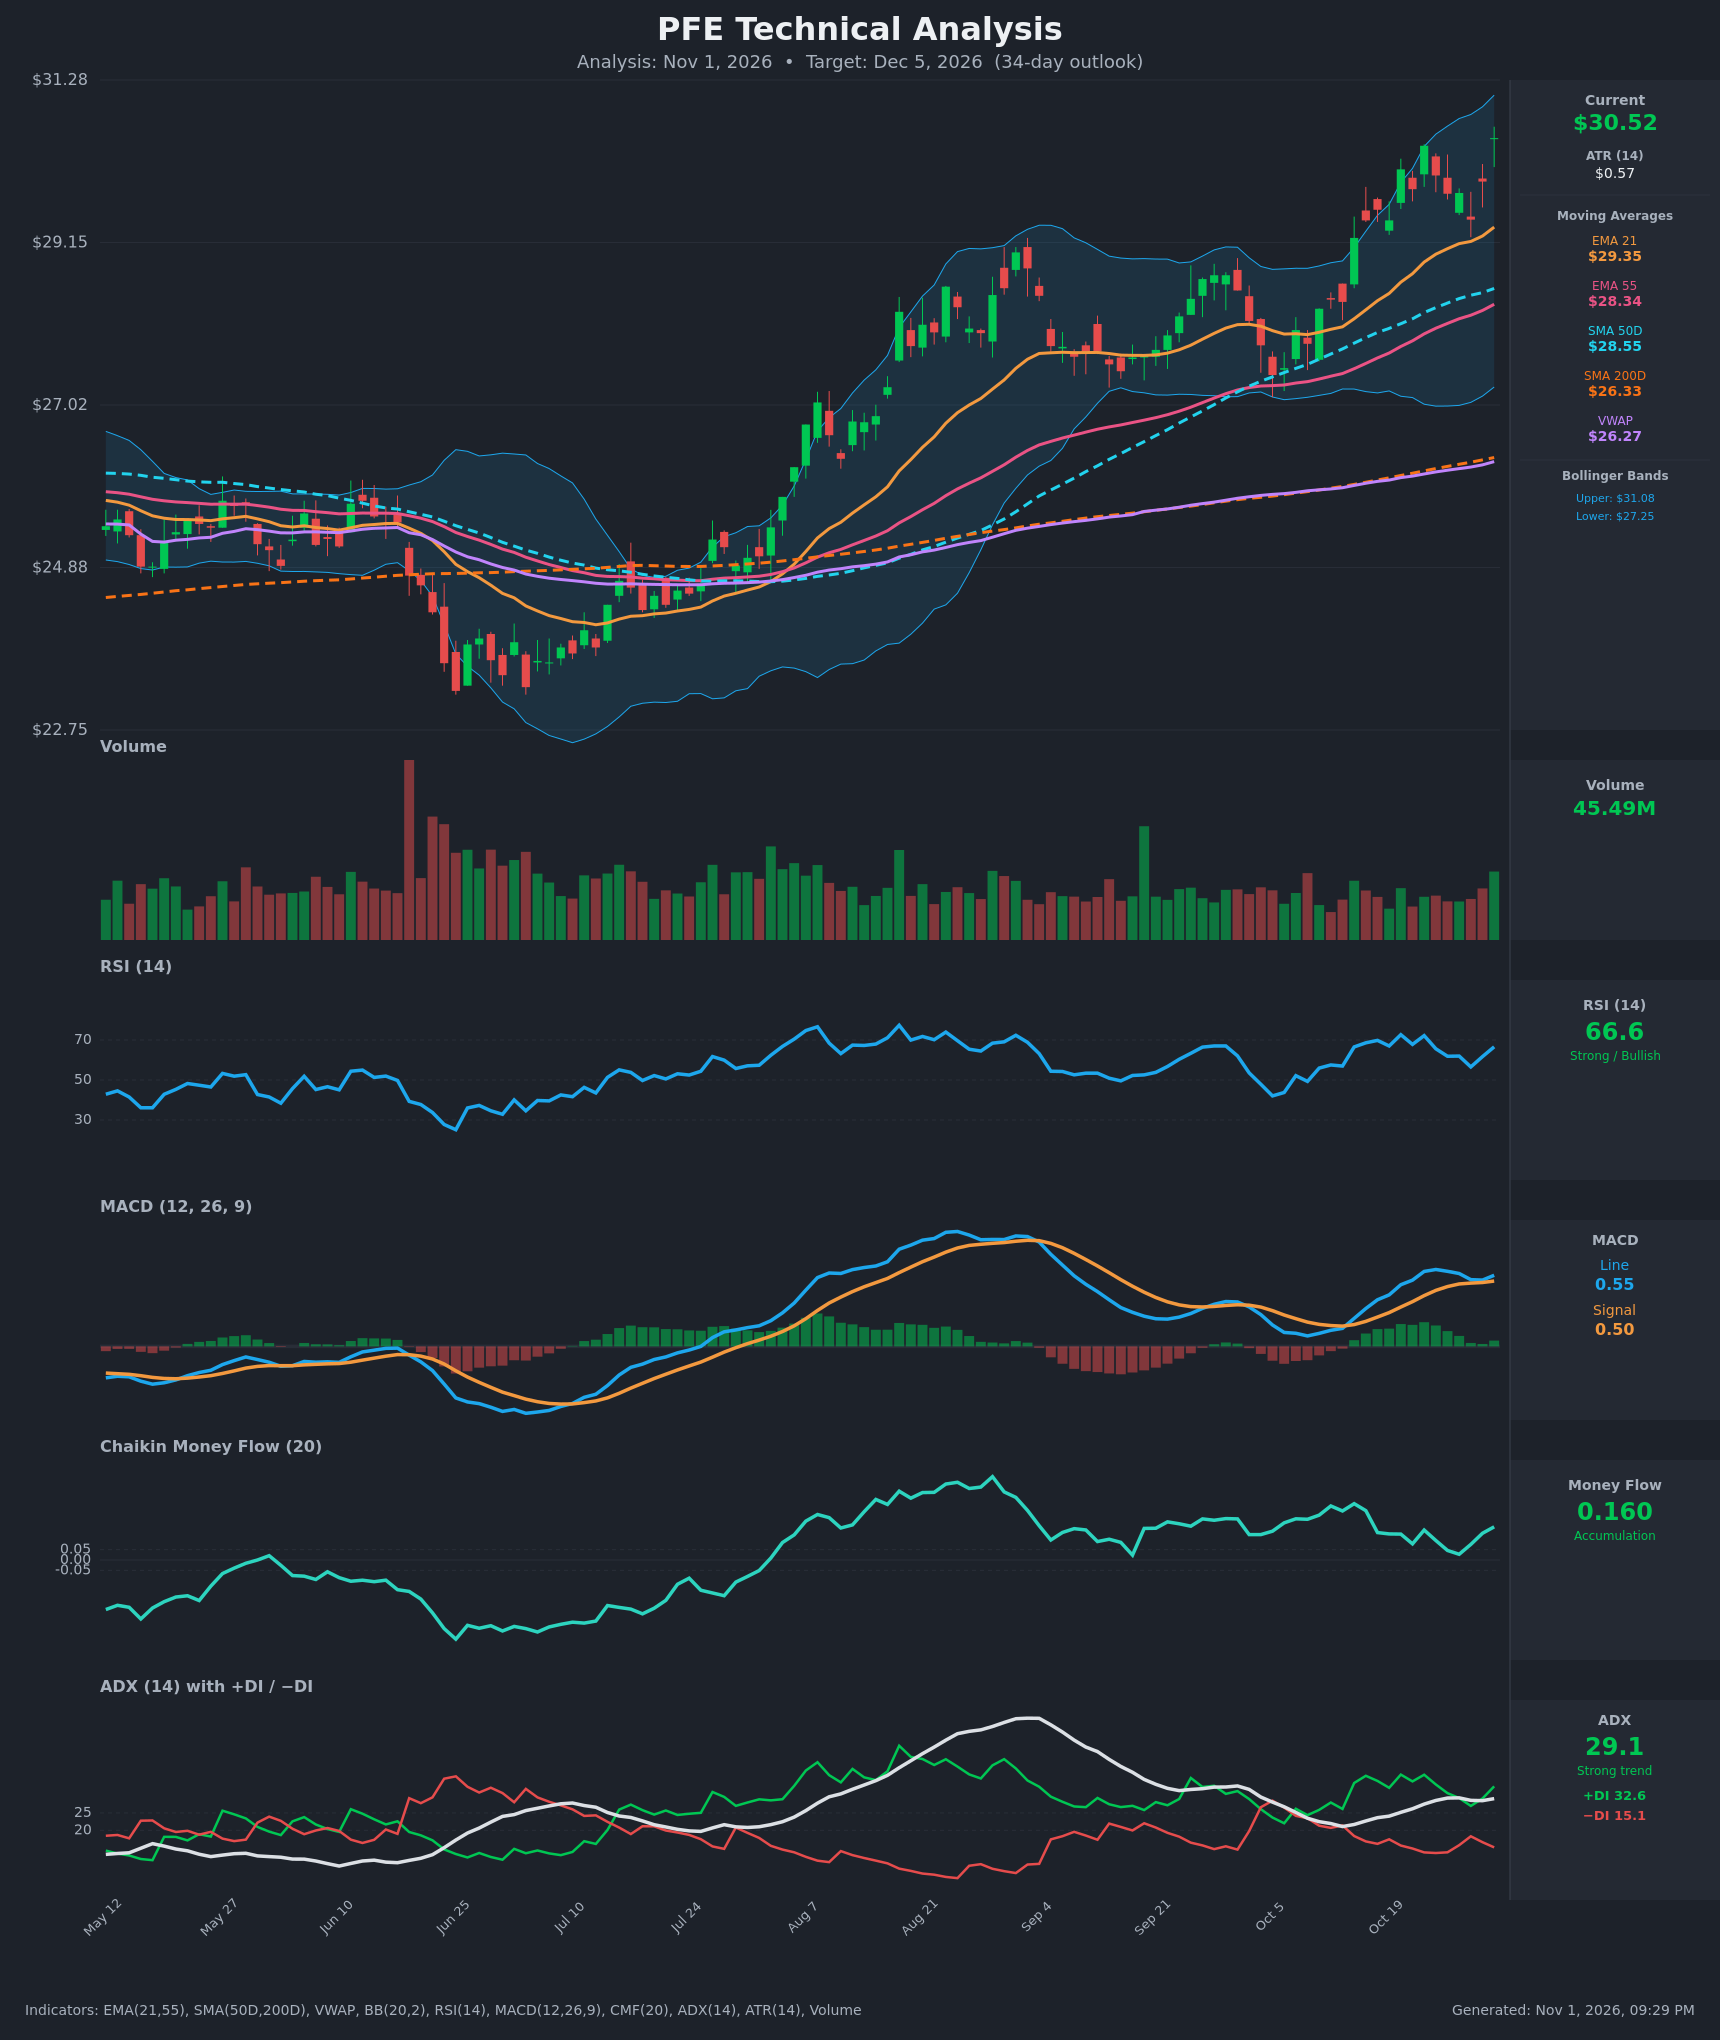
- RSI (14): 66.58, in the upper half of the range but just below 70. It dipped to 56.5 on Oct 28 and has rebounded sharply, so momentum is rising. It reached 72.7 and 72.2 on Oct 20 and Oct 22, so the reading is strong but not yet stretched. [Bullish]
- 20 EMA (EMA 21 used): $29.35, with price at $30.52 about 4% above it. The EMA is rising steeply and sits above EMA 55 ($28.34). The pullback to Oct 28 held just above it, so it is the first dynamic support. [Bullish]
- MACD: Line 0.549 is above Signal 0.504, and the histogram is about +0.045. It narrowed to +0.019 on Oct 29 and has re-widened, so the bullish crossover is intact and momentum is re-accelerating. The line is still below the early-Sep peak, which leaves room for more upside. [Bullish]
- Bollinger Bands (20): Upper $31.08, lower $27.25, midline about $29.17. Price sits at about 85% of the band width, close to the upper band but not breaking out. Walking the upper band in a trend is normal, though the bands are widening, which shows expanding volatility. [Bullish]
- CMF (20): +0.160, well above the +0.05 accumulation threshold. It has stayed positive through the whole advance and has turned up from +0.028 on Oct 27. This is solid buying pressure behind the move. [Accumulation]
- ADX (14): 29.1 and rising from 24 in mid-Oct, with +DI 32.6 well above −DI 15.1. This is a strong, established uptrend with bulls clearly in control. [Strong Trend – Bullish]
- Volume: 45.49M, with the latest bar green and above the recent average. This is a modest expansion on the breakout to a new high, which supports follow-through. The last candle has a small upper wick near $30.8, a minor sign of supply. [Mildly Bullish confirmation]
DIVERGENCES & TRENDS
- Divergences: There is no clear bearish RSI or MACD divergence. RSI peaked at 72.7 (Oct 20) and 72.2 (Oct 22), while price made a higher close at $30.52 with RSI at 66.6. That is a mild lower-high in RSI against a higher high in price, worth monitoring but not yet a confirmed divergence.
- Moving averages: The stack is fully bullish: Price > EMA21 > EMA55 > SMA50 > SMA200 > VWAP. The golden cross (SMA50 over SMA200) is already in place, and the gap between them is widening. Price is far above SMA200 ($26.33) and VWAP ($26.27), a long-term uptrend that is also somewhat extended.
- Trend in the indicators: MACD, ADX, CMF and RSI all re-accelerated after a shallow Oct 23–28 pullback. The chart shows a steady series of higher highs and higher lows since the late-June low near $23.
- Crossovers: There are no bearish crossovers. +DI has held above −DI since mid-Oct, and MACD has stayed above Signal.
CHART PATTERNS
- Bullish Flag / Continuation: After the Oct 14–22 impulse leg, price drifted sideways to slightly lower (Oct 23–28) on low volume, then broke back above the $30.42 swing high. This resembles the Bullish Flag in the reference diagram. The measured move (the roughly $2 flagpole added to the breakout) points to $32.5, possibly higher than a 34-day horizon allows.
- Longer-term structure: The advance from the June low is a rising channel of higher highs and higher lows, a broader continuation trend. The earlier Aug–Sep consolidation near $28–29 acted as a base that has now been cleared.
- Caution: The upper Bollinger Band at about $31.08 and the 70 RSI zone could cap the move in the short term. A pullback to the EMA21 would be normal within the flag/trend structure.
POTENTIAL SCENARIOS
- Scenario 1: Bullish Trend Continuation — The flag breakout holds and the uptrend extends, with shallow dips bought near the EMA21. Trigger: daily close above $31.10 (upper BB) with volume above 45M. Target: $32.50 to $33.40. Invalidation: close below $29.30 (EMA21). (55% probability)
- Scenario 2: Bearish Pullback to Trend Support — RSI near 70 and a stretched price lead to profit-taking, with a mean-reversion move toward the SMA50 and midline while the larger uptrend stays intact. Trigger: rejection at $31.00–31.10 and a close below $29.35. Target: $28.50–$28.90 (SMA50/EMA55 zone). Invalidation: reclaim of $30.50 on rising volume. (30% probability)
- Scenario 3: Neutral Consolidation — Price chops between the EMA21 and the upper band while ADX cools. Trigger: failure to extend above $31.10 without a close below $29.35. Target: $29.50–$31.00. Invalidation: close outside that band. (15% probability)
PRICE TARGETS
For a 34-day horizon the Expected Range should be about 12–18% of price. The range below is $4.60 wide, or about 15.1% of $30.52, which fits.
- Target Price: $31.70 (34-day)
- Expected Range: $28.80 to $33.40
- Key Levels: Support at $29.35 (EMA21; next support at $28.55 SMA50), Resistance at $31.08 (upper Bollinger Band; next resistance at $32.50 flag measured move)
OVERALL BIAS
OVERALL BIAS: BULLISH - A stacked bullish moving-average structure, a strong ADX with +DI dominant, positive CMF accumulation and a MACD that is above Signal and re-widening all support further upside after the flag breakout. The main risks are an RSI near 70 and a price close to the upper Bollinger Band, which makes a pullback toward $29.35 possible along the way.
This is educational analysis and not financial advice.