QUBT 34-day bearish forecast — Nov 1, 2026
- Bias: Bearish
- Timeframe: 34 days (made Nov 1, 2026, target date Dec 4, 2026)
- Price at analysis: $6.60
- Price target: $6.00
- Expected range: $5.00 – $7.20
- Result: Pending — graded after the close on Dec 4, 2026
Get a free AI analysis of QUBT today
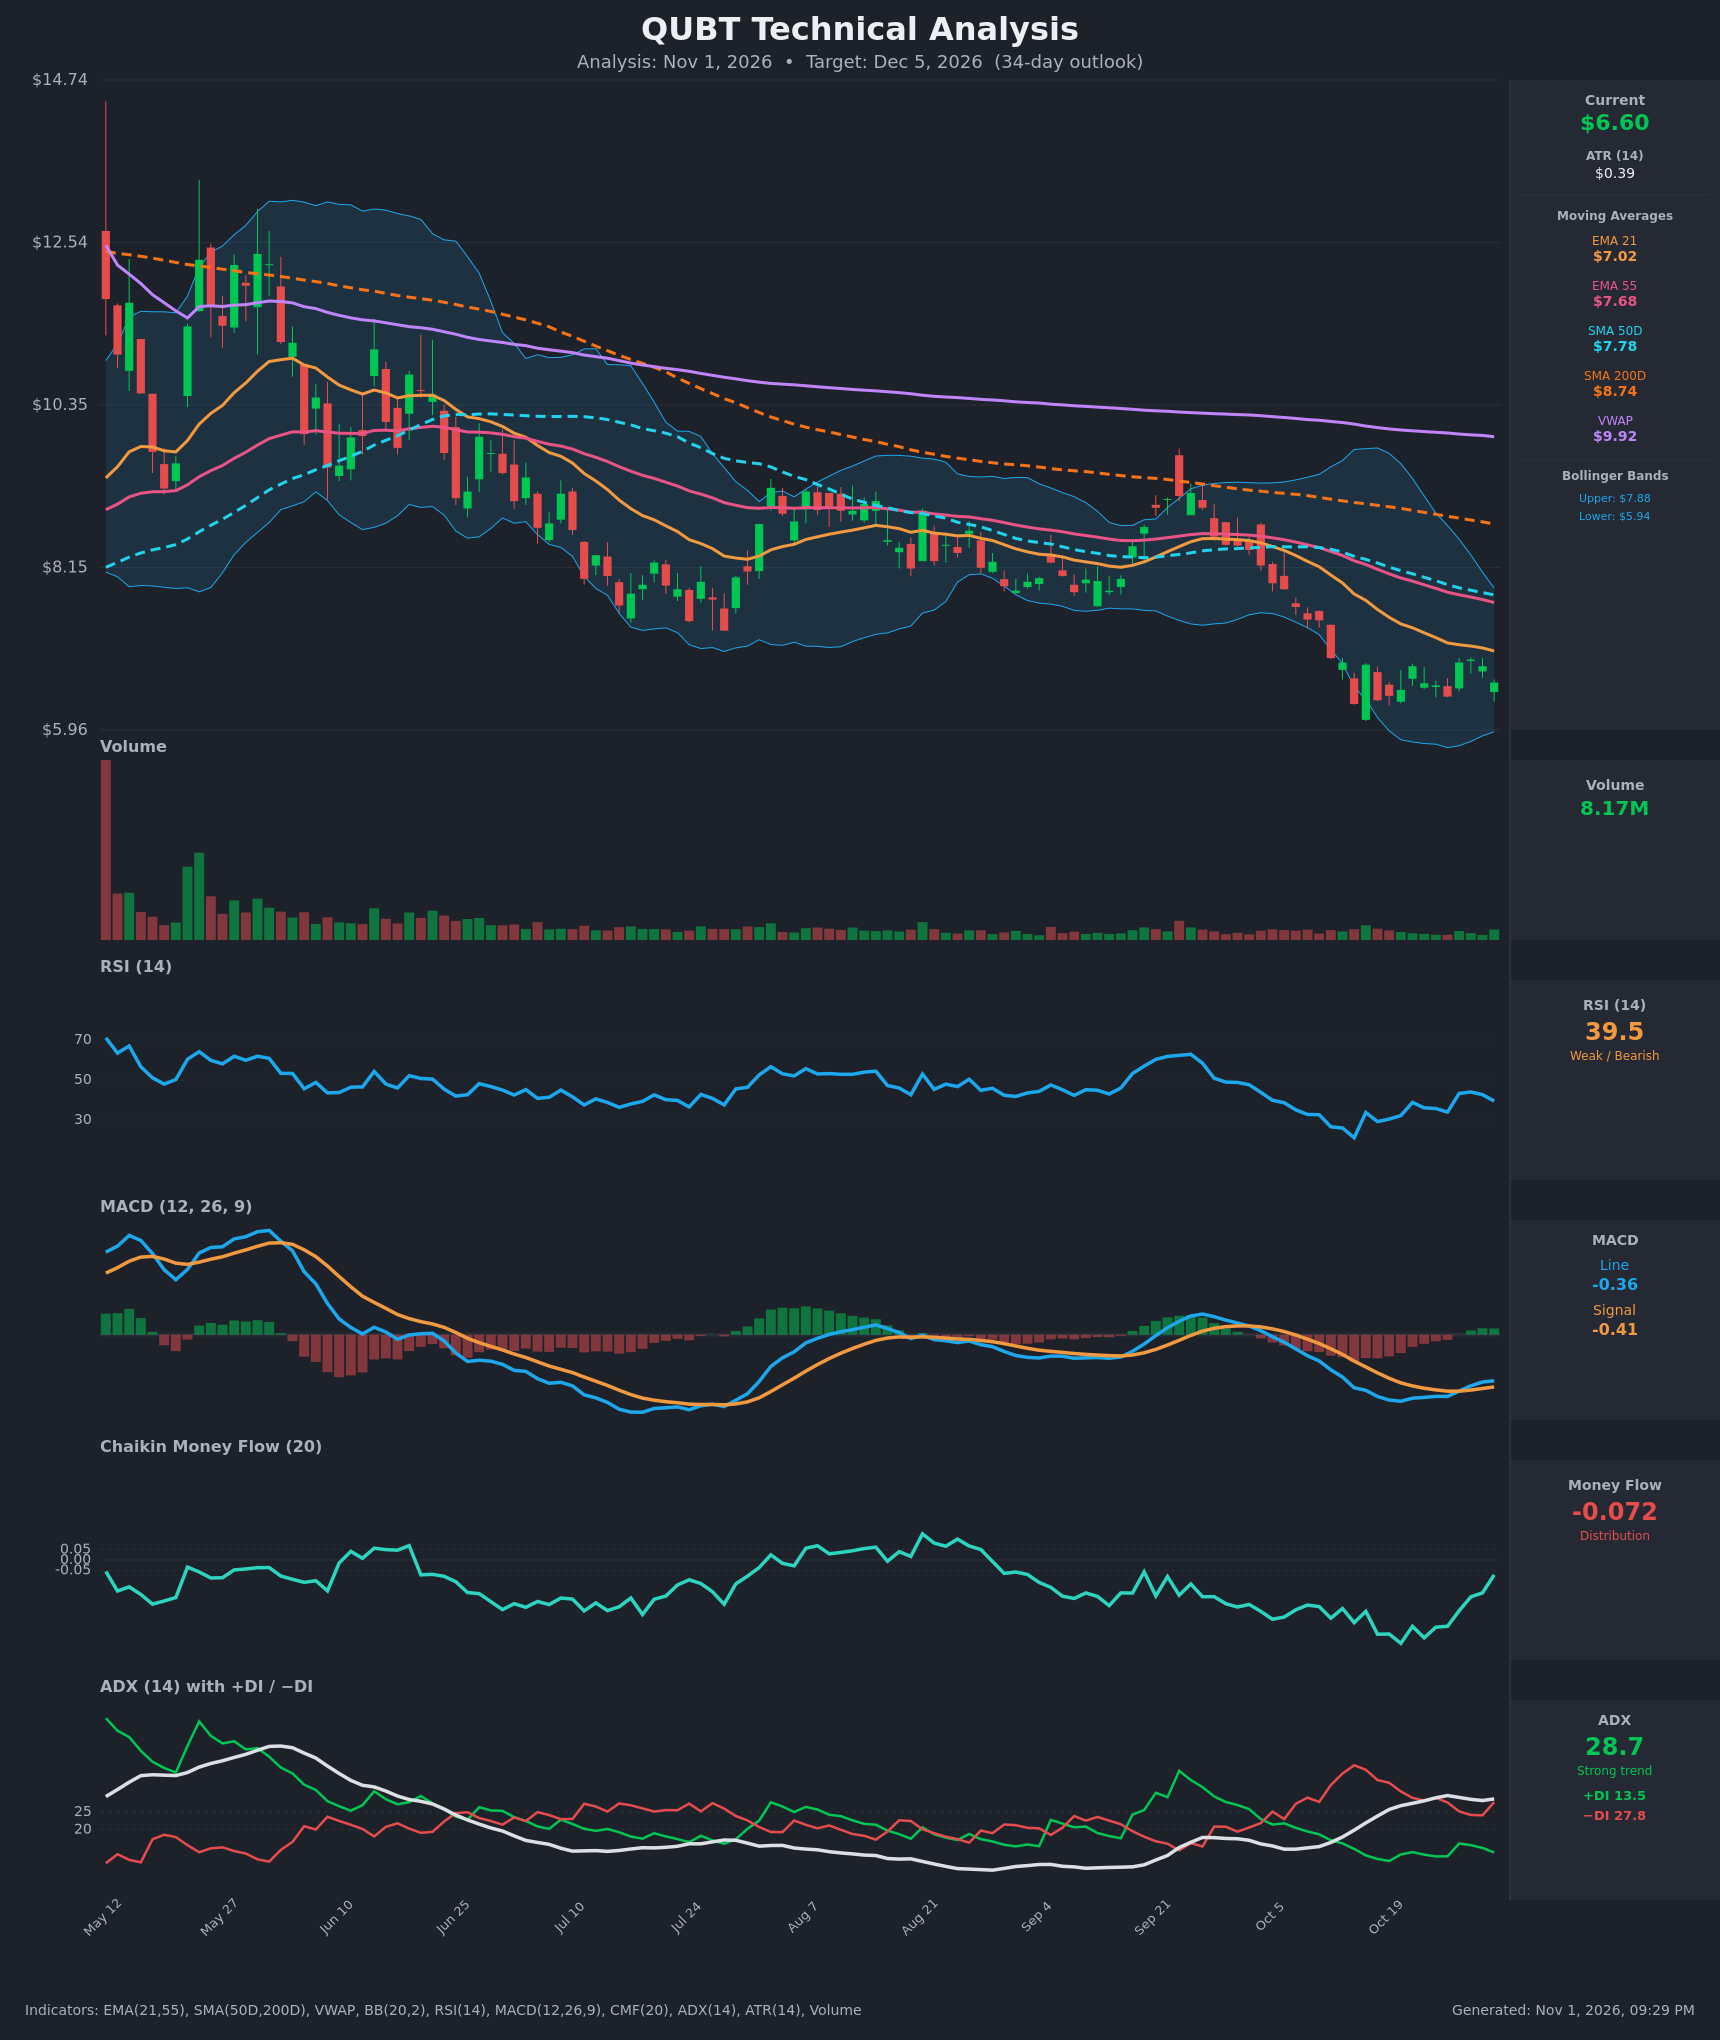
Analysis
TECHNICAL INDICATORS
- RSI (14): 39.48. It is below 50 but has recovered from the 21–26 oversold zone on Oct 14. It is lower than the 44 reached on Oct 28, so the bounce is fading. Momentum is weak but not oversold. [Bearish]
- 20 EMA (EMA 21): $7.02, with price at $6.60 below it. EMA 21 is falling steeply and sits below EMA 55 ($7.68), SMA50D ($7.78) and SMA200D ($8.74). The EMA 21 is acting as overhead resistance. [Bearish]
- MACD: Line -0.364 is just above the signal -0.413, so the histogram is slightly positive. The line crossed above the signal on Oct 27 and is rising. Both lines are still well below zero, so this is a bear-market momentum bounce, not a trend reversal. [Neutral]
- Bollinger Bands (20): Upper $7.88, lower $5.94, with the midline near $6.9. Price at $6.60 is in the lower half, about 1.7 ATR above the lower band. The bands are tightening after the sell-off, and the Oct 14 low touched the lower band. [Bearish]
- CMF (20): -0.072, below the -0.05 distribution threshold. It has improved from -0.40 and is trending up, but it is still negative. Selling pressure is easing without turning into accumulation. [Distribution]
- ADX (14): 28.7, with +DI 13.5 below −DI 27.8. This is a strong downtrend, and ADX has been above 25 for about 8 sessions. −DI is still well above +DI, though the gap has narrowed from 38 to 27.8. [Strong Trend – Bearish]
- Volume: 8.17M, light compared with the capitulation bars in the mid-October sell-off and the spike in May. The recent bounce came on low volume, so buyers are not convinced. [Weak bounce, bearish-leaning]
DIVERGENCES & TRENDS
- Moving averages: The bearish stack is intact (price < EMA21 < EMA55 < SMA50D < SMA200D < VWAP). The SMA50D ($7.78) is below the SMA200D ($8.74), so the death cross is already in place. Price is about 25% below VWAP, which signals persistent distribution.
- Possible divergence: The Oct 14 low (about $6.31) was made with RSI at 21. The Oct 26 low ($6.41) came with RSI at 33.9, a higher RSI low than the one on Oct 14. This is a mild bullish momentum divergence, and the MACD bullish crossover supports it. Price has not yet broken any resistance, so it is only a bounce warning.
- CMF: It has risen from -0.40 toward -0.07, so selling pressure is easing.
- ADX/DI: ADX is rolling over from 29.7 while +DI is rising off its lows. The trend is strong but maturing.
- Price action: After the drop from about $8 to $6.3, price has traded sideways in a tight $6.4–$6.9 range for about 2 weeks.
CHART PATTERNS
- Bearish Pennant / Flag (continuation): The sharp decline from about $8 to $6.3 followed by a tight, low-volume consolidation resembles a bearish pennant or flag. A breakdown below $6.30 would project a measured move of about $1.5, toward $4.8–$5.0. This is the most relevant pattern in the diagram.
- Bullish Double Bottom (reversal): The lows at $6.31 (Oct 14) and $6.41 (Oct 26) are roughly equal. The neckline is around $6.9, which is also the Oct 27–28 high. A close above $6.95 would confirm it, with a target of about $7.5. Volume and trend context do not yet support this.
- Overall: The bearish continuation is more consistent with the strong ADX and −DI dominance. The double bottom is a credible secondary scenario.
POTENTIAL SCENARIOS
- Scenario 1: Bearish Pennant Breakdown / Trend Continuation — The downtrend resumes as price rolls over from the falling EMA21 and fails to clear the $6.9 neckline. A close below $6.30 would open the way toward the lower band and the $5.50–$5.00 area. Trigger: daily close below $6.30 on rising volume. Target: $5.60 (range $5.00–$5.80). Invalidation: daily close above $7.05 (EMA21). (55% probability)
- Scenario 2: Bullish Double Bottom Recovery — The higher RSI low, the MACD cross and improving CMF lead to a relief rally. Price breaks the $6.95 neckline and moves toward the EMA55 and SMA50D cluster. Trigger: close above $6.95 with volume above 10M. Target: $7.50–$7.80. Invalidation: close below $6.30. (30% probability)
- Scenario 3: Neutral Range Consolidation — Price chops between $6.30 and $7.00 as ADX fades and volume stays light. Trigger: no close outside $6.30–$7.00. Target: $6.50–$6.80. Invalidation: a close outside the range. (15% probability)
PRICE TARGETS
- Target Price: $6.00 (34-day, bearish-leaning)
- Expected Range: $5.00 to $7.20. Width is $2.20, about 33% of the current price. That is wider than the 12–18% guidance for 30–60 days, which I chose deliberately given the volatility (ATR $0.39, about 6% daily) and the binary breakdown/recovery setup. Even a 1.5 ATR-per-week drift gives a band of that size over 34 days.
- Key Levels: Support at $6.30 (recent swing lows, then the $5.94 lower band), Resistance at $7.02 (EMA21, then $7.68)
OVERALL BIAS
OVERALL BIAS: BEARISH - Price sits below every moving average with a death cross in place, ADX at 28.7 with −DI far above +DI, and CMF still in distribution. The low-volume bounce looks like a bearish pennant. The improving RSI and MACD are only enough to slow the decline, so I expect a drift toward $6.00 and a test of the $6.30 support.
This is educational analysis and not financial advice.