SLV 34-day bullish forecast — Nov 1, 2026
- Bias: Bullish
- Timeframe: 34 days (made Nov 1, 2026, target date Dec 4, 2026)
- Price at analysis: $44.60
- Price target: $47.00
- Expected range: $41.80 – $49.20
- Result: Pending — graded after the close on Dec 4, 2026
Get a free AI analysis of SLV today
Analysis
TECHNICAL INDICATORS
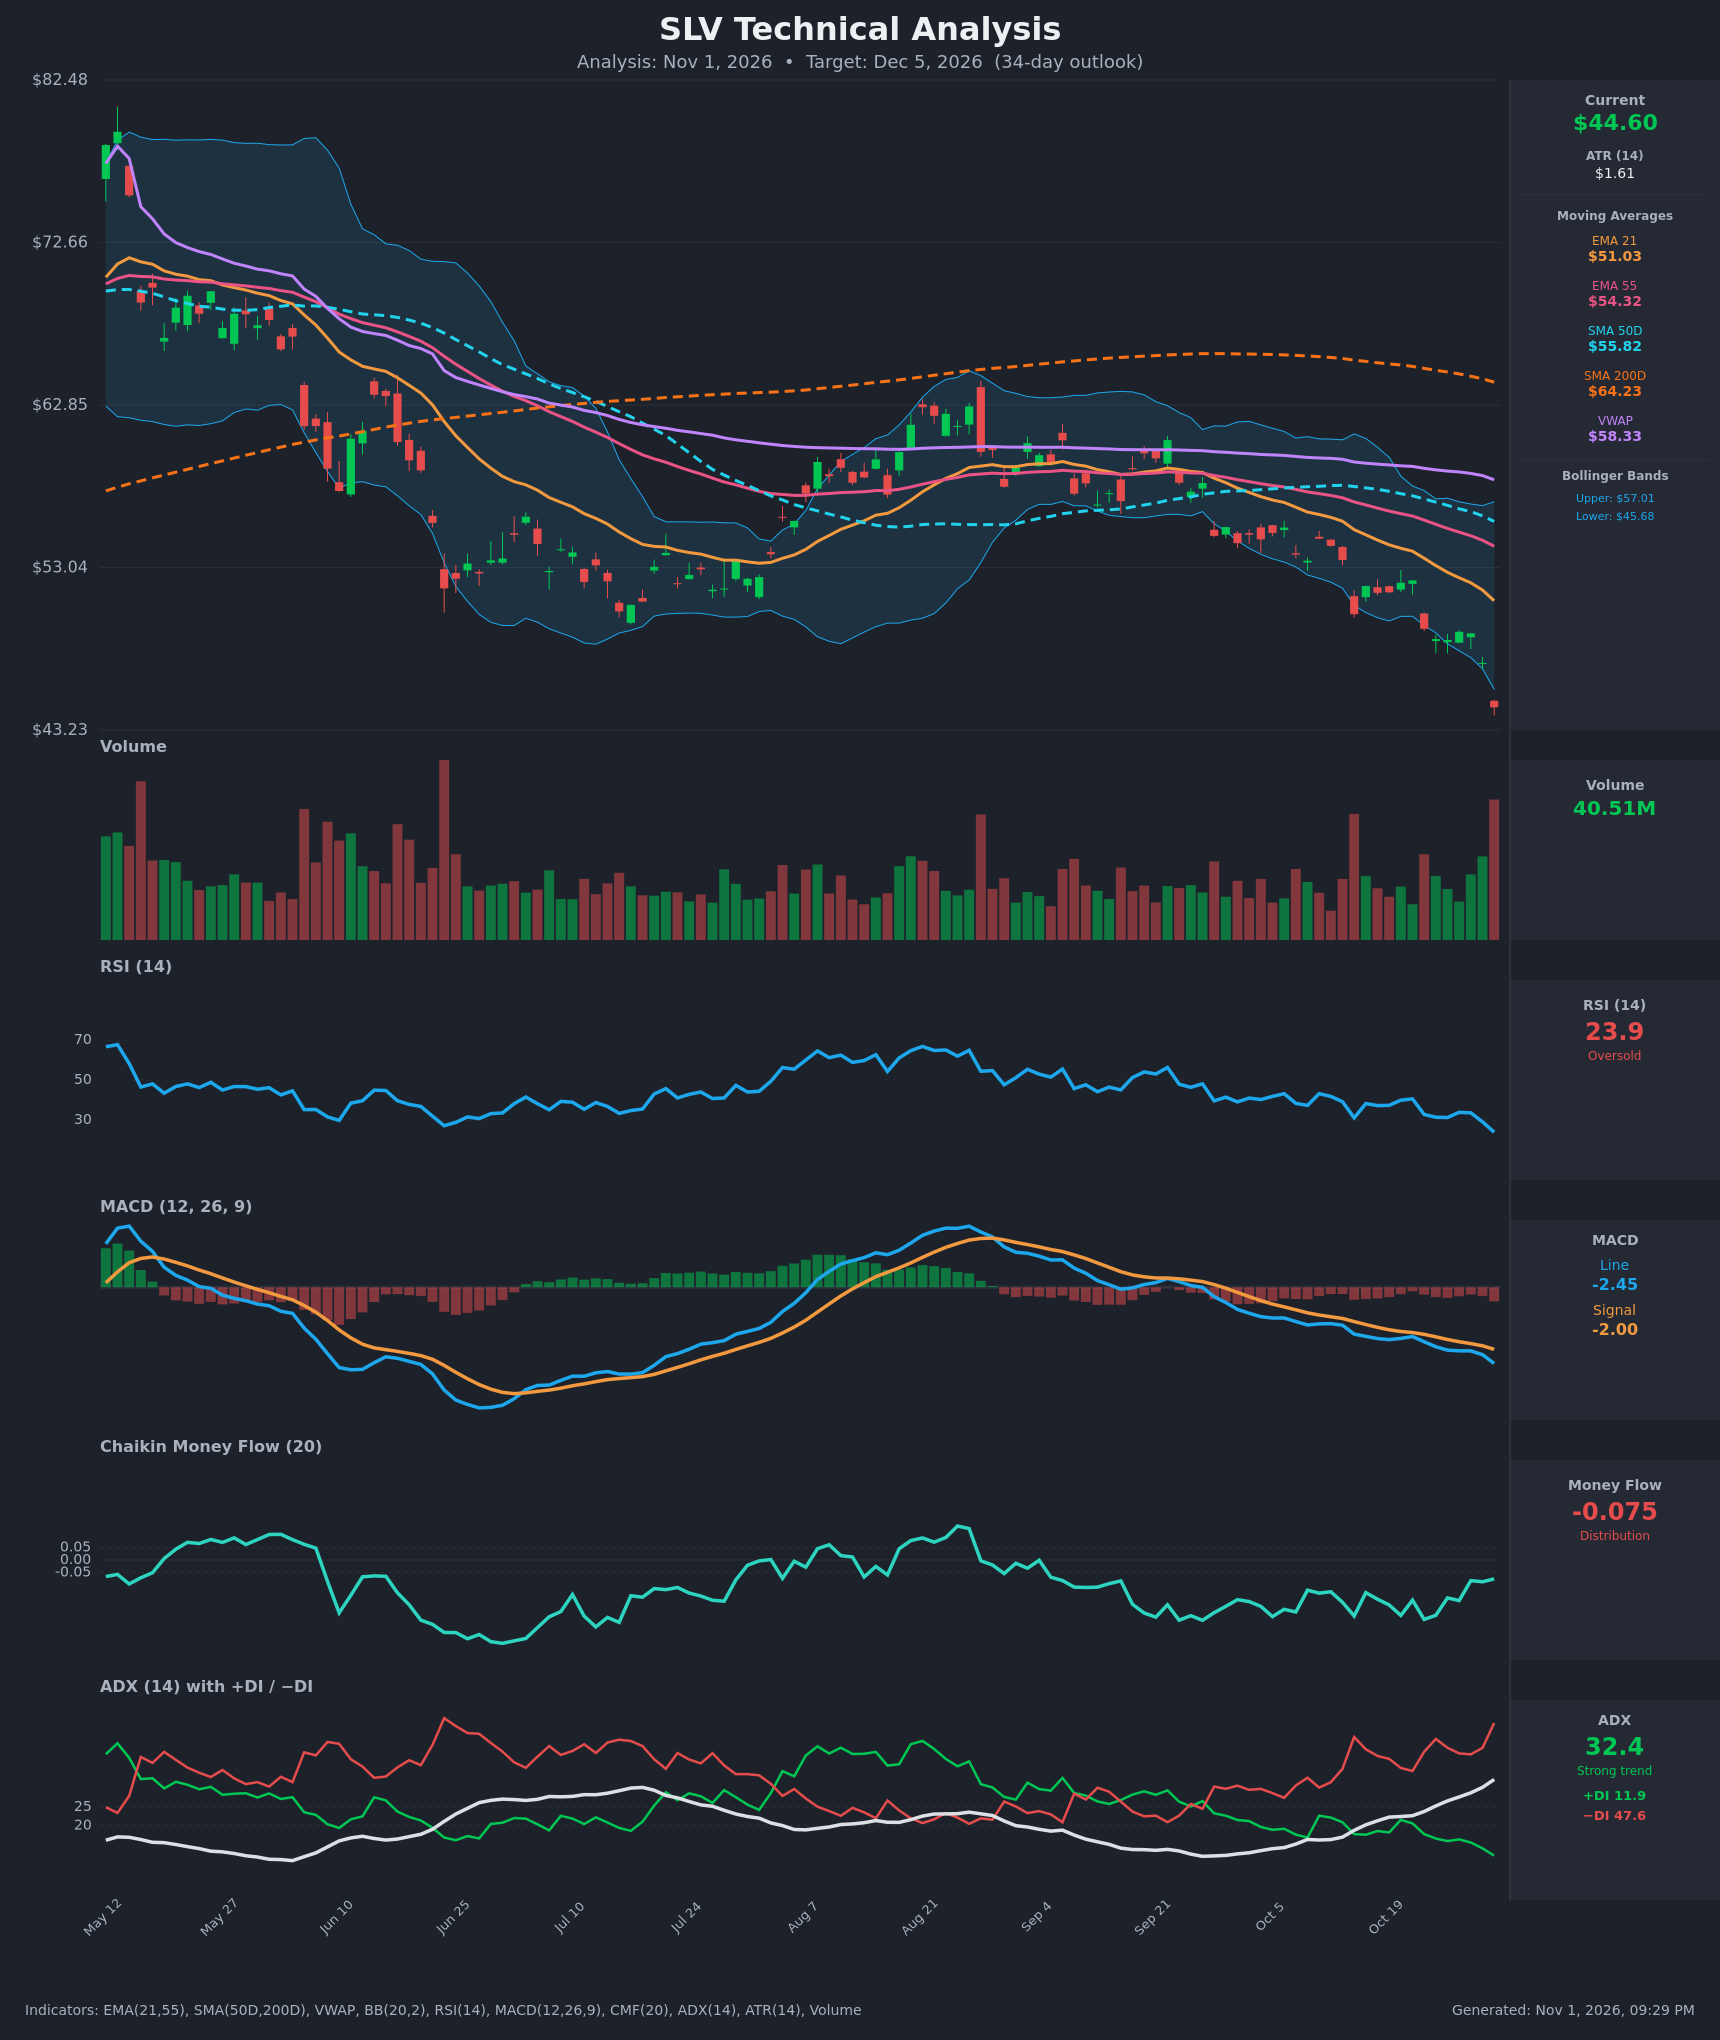
- RSI (14): 23.90, deeply oversold and the lowest reading on the chart, below the late-June trough near 27. It has fallen from 41.8 on Oct 12 with no bullish divergence. Momentum is still pointing down, but the reading is stretched. [Bearish]
- 20 EMA: The supplied EMA 21 is $51.03, and price at $44.60 is about 12.6% below it. The EMA is falling steadily (56.07 to 51.03 in 15 bars) and acts as overhead resistance. EMA 55 ($54.32) is also well above price, and EMA21 is below EMA55 (bearish alignment). [Bearish]
- MACD: Line -2.45 is below Signal -2.00, and both are below zero. The histogram is negative and widening (the gap grew from about -0.22 to -0.45 in the last 15 bars). The bearish crossover is established and momentum is accelerating down. [Bearish]
- Bollinger Bands (20): Upper $57.01, lower $45.68. Price at $44.60 closed below the lower band, an extreme statistical stretch after the bands expanded downward. In a strong trend this is a "band walk", but it also raises the odds of a snap-back toward the mid-band (~$51.3). [Neutral]
- CMF (20): -0.075, below the -0.05 threshold, so mild distribution. It has been negative for the entire 15-bar window (range -0.08 to -0.24). It is improving off the lows (-0.237 on Oct 22), which hints at selling pressure fading, but it is not positive. [Distribution]
- ADX (14): 32.4 and rising (16.2 to 32.4 in 15 bars), a strong trend. −DI at 47.6 dominates +DI at 11.9, a very wide spread, so bears are firmly in control. [Strong Trend – Bearish]
- Volume: 40.51M on the latest bar, among the highest of the whole chart and similar to the June capitulation bars. A big-volume breakdown to new lows confirms the selling. It can also mark a climactic washout, though one bar is not a confirmed reversal. [Heavy selling / possible capitulation]
DIVERGENCES & TRENDS
- No bullish divergence: RSI, MACD and CMF all made fresh lows with price. Oversold alone is not a reversal signal.
- Moving-average structure: A death cross is already in place (SMA50D $55.82 below SMA200D $64.23). Price is below every average (EMA21, EMA55, SMA50D, SMA200D, VWAP $58.33), so the long-term trend is firmly down.
- Price action: Price broke down from the Sep consolidation around $56–58 and has made lower highs and lower lows. Roughly $54 to $44.60 fell in about 14 trading days.
- Stretch: Price is about 2 ATR below the lower Bollinger Band and RSI is below 25. The June washout (RSI ~27) was followed by a multi-week range and then a rally. That is a reminder that extreme readings tend to produce at least a relief bounce.
- CMF: Its recovery from -0.237 to -0.075 while price fell is a mild positive divergence, but it is still below zero.
CHART PATTERNS
- Bearish continuation after a consolidation breakdown: The Aug–Oct range at ~$55–60 resolved lower, similar to a descending-triangle or bearish-flag breakdown in the reference diagram. The measured move of that range (~$5–6 of height from ~$53–54) points to ~$47–49, which price has already exceeded.
- No confirmed reversal pattern yet: There is no double bottom or inverted head and shoulders. The June–July base near $50–51 shows how a base can form after a washout, but that base is not present now.
- Significance: The pattern backdrop favors trend continuation. Extreme oversold conditions argue for a relief bounce rather than a trend change. Overhead supply sits at $45.68 (lower band), ~$48.7–49.2 (Oct 23–28 lows) and $51 (EMA21).
POTENTIAL SCENARIOS
- Scenario 1: Bullish Oversold Relief Bounce — The capitulation-volume break below the lower band and RSI under 25 trigger a mean-reversion rally that stalls under the falling EMA21. Trigger: daily close back above the lower band at $45.68 and then above $48.70. Target: $47.00–$49.50, with a stretch toward the EMA21 at ~$51. Invalidation: a daily close below ~$42.00. (50% probability)
- Scenario 2: Bearish Trend Continuation — With ADX rising, −DI dominant and MACD widening, price keeps walking the lower band, and any bounces are sold below $46–48. Trigger: failure to reclaim $45.68 and a break below $43.23 (the chart's prior low-end level). Target: $40.50–$42.00 (about 2–2.5 ATR lower). Invalidation: a close above $48.70. (37% probability)
- Scenario 3: Neutral Basing Range — Price stabilizes after the washout, similar to the June–July base, chopping around $43–$48. Trigger: declining volume and narrowing ranges. Target: ~$44–46. Invalidation: a close outside $42–$49. (13% probability)
PRICE TARGETS
34-day horizon (range width check: $49.20 − $41.80 = $7.40, which is 16.6% of $44.60, within the 12–18% guidance for 30–60 days).
- Target Price: $47.00 (a partial relief bounce, still below the EMA21 and falling averages)
- Expected Range: $41.80 to $49.20
- Key Levels: Support at $42.00 (near the 2.0 ATR extension and the lower edge of the expected range), Resistance at $48.70 (Oct 23–28 low area; the first hurdle is the lower Bollinger Band at $45.68, and the EMA21 at $51.03 sits above that)
OVERALL BIAS
OVERALL BIAS: BULLISH - Price is stretched far below the lower Bollinger Band with RSI at 23.9 and climactic volume, and CMF is improving from its lows. A relief bounce toward $47 is the most probable 34-day outcome. The bounce is expected to be capped below the falling EMA21 because the trend (ADX 32.4, −DI 47.6, death cross, bearish MACD) remains firmly bearish, so conviction is modest.
This is educational analysis and not financial advice.