ARM 48-day bearish forecast — Nov 1, 2026
- Bias: Bearish
- Timeframe: 48 days (made Nov 1, 2026, target date Dec 18, 2026)
- Price at analysis: $205.97
- Price target: $190.00
- Expected range: $170.00 – $208.00
- Result: Pending — graded after the close on Dec 18, 2026
Get a free AI analysis of ARM today
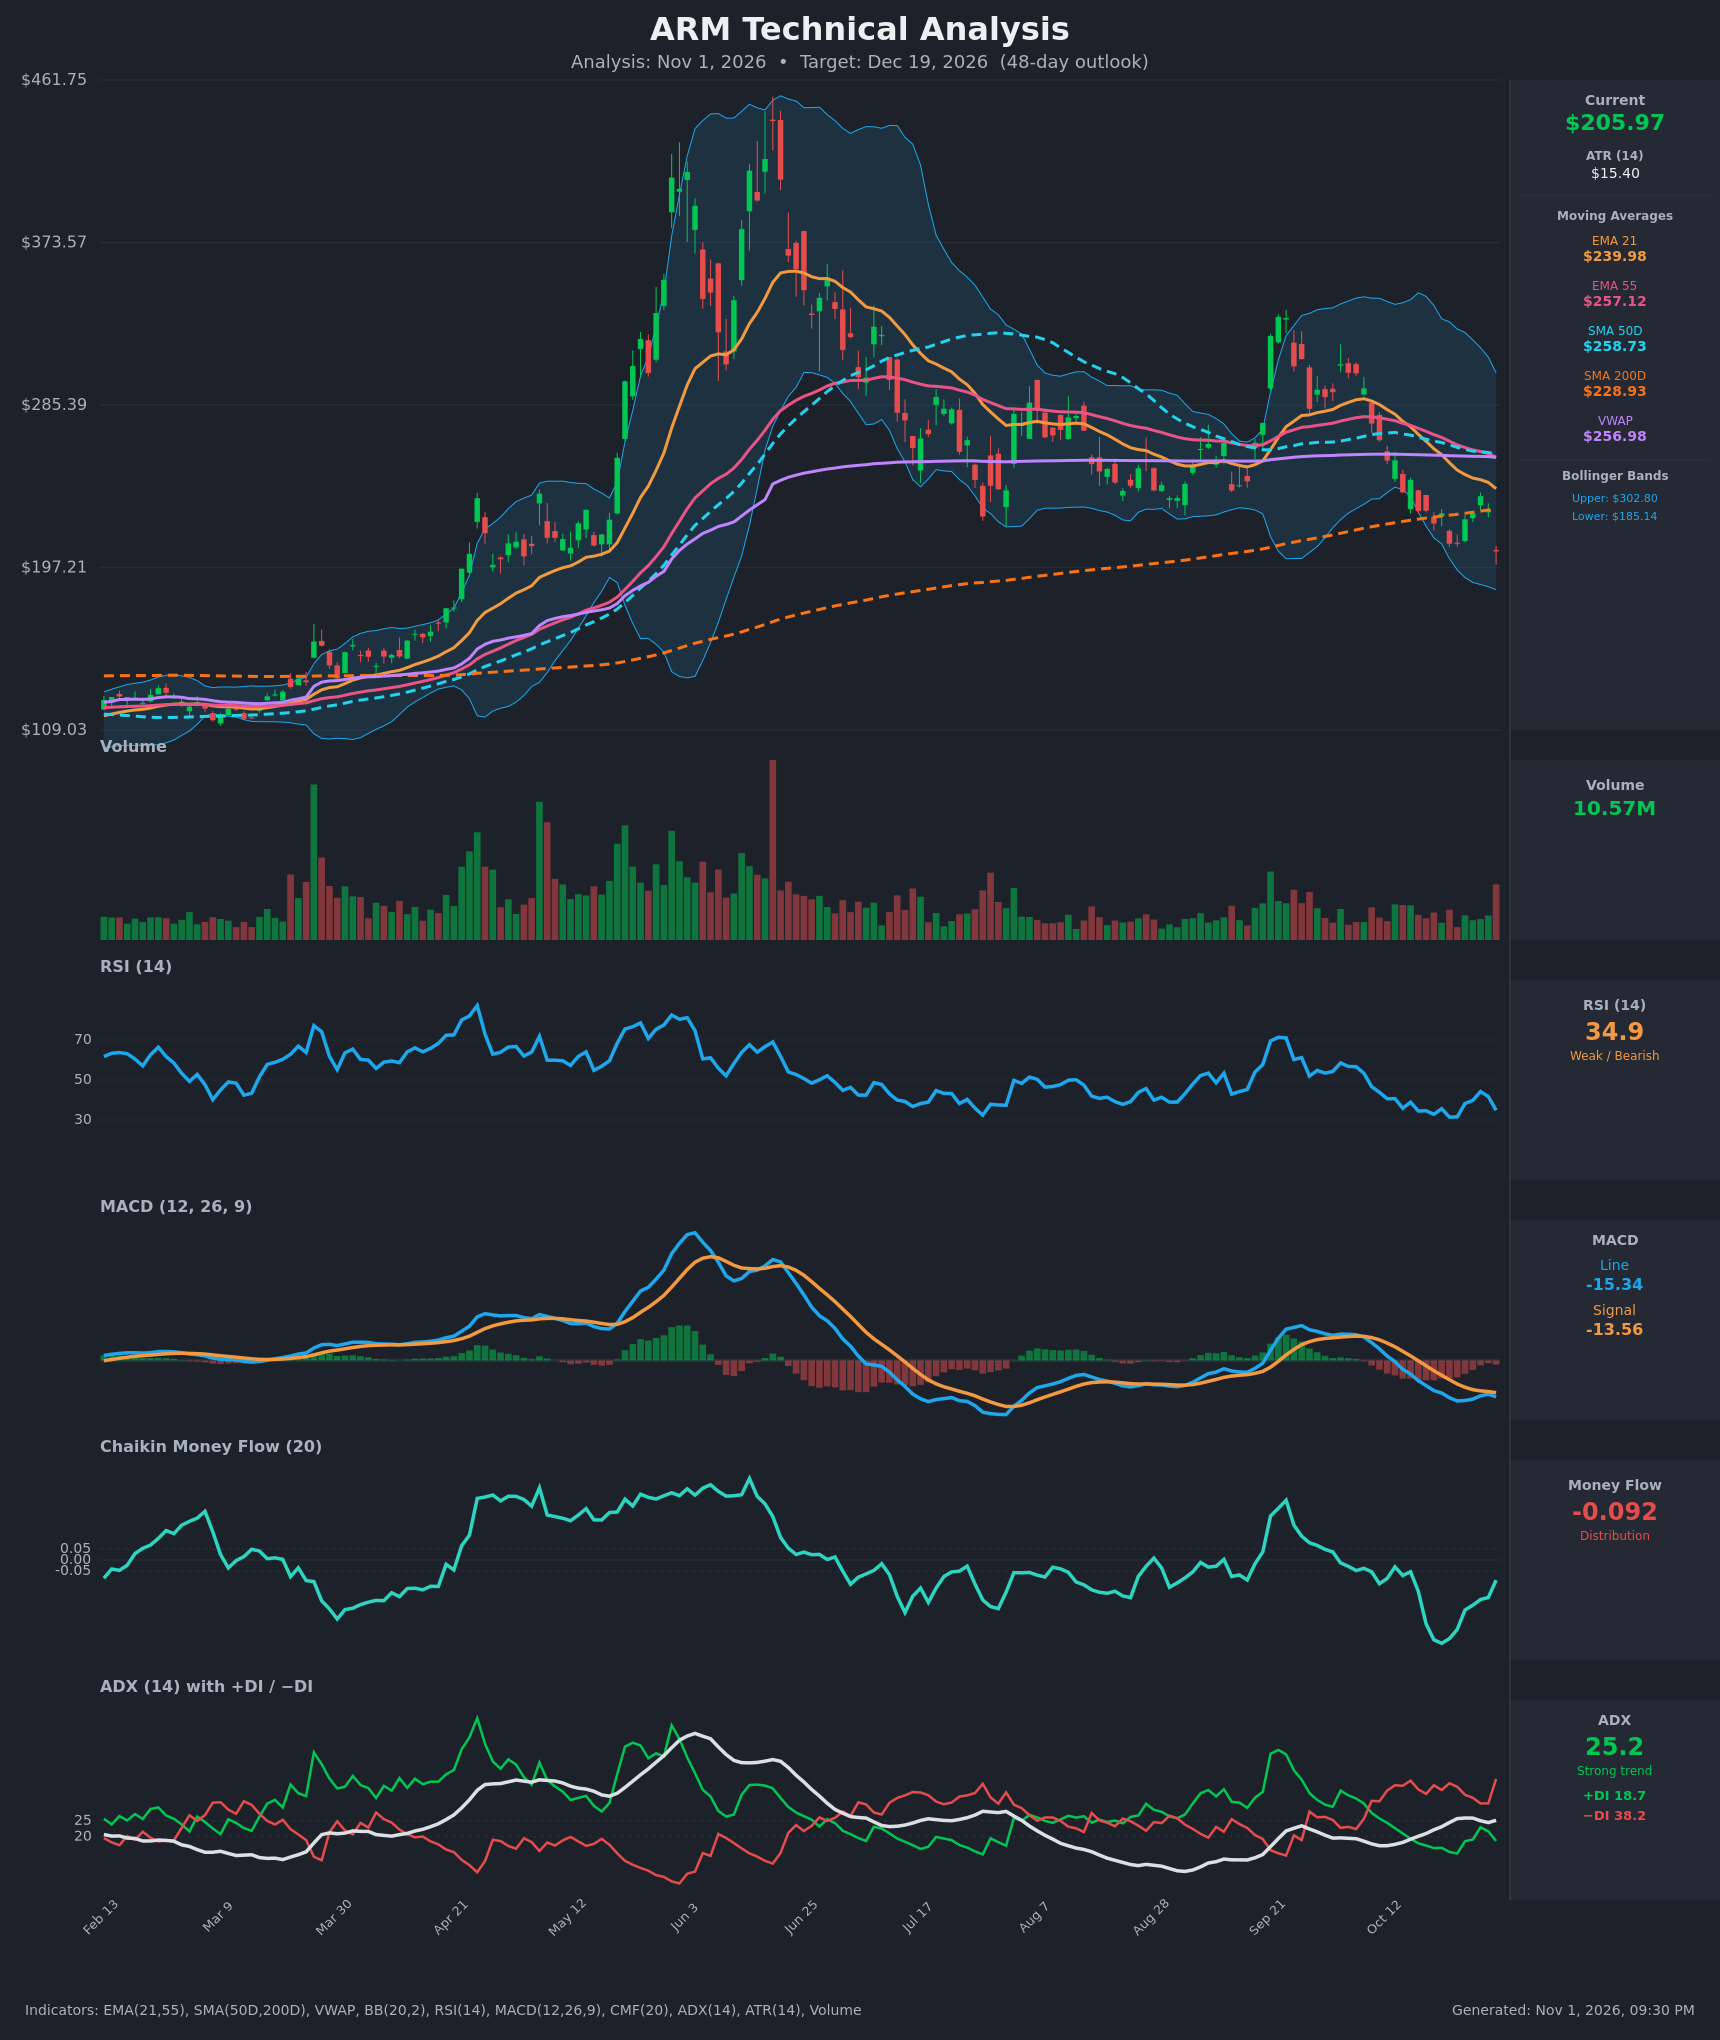
Analysis
TECHNICAL INDICATORS
- RSI (14): 34.86, down from 41.7 the prior day and close to the recent 31.4 low. It is weak but not yet below 30, so there is room for further downside before a classic oversold reading. Momentum is falling. [Bearish]
- 20 EMA (EMA 21): $239.98, with price at $205.97 about 14% below it. The EMA is falling steeply (it was $282.87 on Oct 12) and acts as overhead resistance. EMA21 is also below EMA55 ($257.12), a bearish alignment that has been in place since mid-October. [Bearish]
- MACD: Line -15.35 is below Signal -13.56, giving a negative histogram of about -1.8. The line crossed below the signal in mid-October and both are well below zero. The Oct 26-29 histogram narrowing has reversed with the latest sell-off. [Bearish]
- Bollinger Bands (20): Upper $302.80, lower $185.14. Price is in the lower third of the bands, about $21 above the lower band, after a 10% one-day drop. The bands are wide, so volatility is elevated. A walk down the lower band is possible, but a bounce from the lower band is also common. [Bearish]
- CMF (20): -0.092, below the -0.05 threshold. It has been negative for weeks, with a trough of -0.379 on Oct 21, and it has only partially recovered. This means sustained distribution. [Distribution]
- ADX (14): 25.2 and rising from 17 to 25 over the past two weeks, with −DI (38.2) far above +DI (18.7). This is a strong, developing downtrend with bears firmly in control. [Strong Trend – Bearish]
- Volume: 10.57M on the 10% down day. This is modest compared with the major spikes earlier in the year, so the capitulation is not yet convincing. Volume has been heavier on down days recently. A high-volume washout has not yet occurred. [Bearish, not yet capitulation]
DIVERGENCES & TRENDS
- No clear divergence. RSI (31.4 → 34.9) made a slightly higher low than its Oct 22-23 trough while price made a lower low. This is a mild, unconfirmed bullish hint that would need a close back above ~$228 to matter.
- Moving-average structure: Price is below EMA21, EMA55, SMA50D ($258.73) and VWAP ($256.98), and has just closed below the SMA200D ($228.93). That is a breakdown through the long-term trend line. The SMA50D is rolling over and is still above the SMA200D, so no death cross has formed yet. One could develop over the next few weeks if the decline continues.
- EMA/MACD crossovers: The EMA21 crossed below the EMA55 around Oct 15 (bearish). The MACD bearish crossover came on Oct 16. Both remain in force.
- DI/ADX: −DI has been above +DI since early October, and the widening spread with a rising ADX confirms trend strength.
- Larger structure: The June peak (~$450) was followed by a lower high (~$330) in September, and now a break below the $210-$225 support area. This is a pattern of lower highs and lower lows.
CHART PATTERNS
- Bearish continuation / failed-rally structure (similar to the Bearish Flag/Pennant in the reference): After the sharp fall from September's ~$330 high, price consolidated in the $225-$255 zone, then broke down with a 10% drop through the SMA200D and the $210 swing lows.
- Lower-high structure: Peaks at ~$450 and ~$330 resemble a long-term distribution pattern, similar to a Bearish Double Top/Head and Shoulders on a larger scale. This is a loose resemblance and not a textbook fit.
- Targets: The breakdown targets the lower Bollinger Band at $185 and then roughly $170-$175. A measured move of the flag pole would reach lower still, but that is less probable within 48 days.
- Caveat: Price is near the lower band and has bounced from the $210 area before, so a relief rally toward the SMA200D at ~$229 is a real risk to the bearish thesis.
POTENTIAL SCENARIOS
- Scenario 1: Bearish Trend Continuation — Price stays below the falling EMA21 and SMA200D, with −DI dominant and CMF negative. Price drifts lower to the lower Bollinger Band and slightly beyond, with rallies sold into $215-$229. Trigger: daily close below $197 (the next support), with the MACD histogram staying negative. Target: $185 first, then $172-$185. Invalidation: daily close above $229 (SMA200D reclaimed) with CMF turning positive. (50% probability)
- Scenario 2: Bullish Relief Bounce — Oversold conditions and the lower-band proximity trigger a short-covering rally back to the former support, which is now resistance. Trigger: close above $216-$220 on rising volume, with RSI back above 45. Target: $229-$240 (SMA200D and EMA21). Invalidation: failure at $229 followed by a close below $197. (30% probability)
- Scenario 3: Bearish Acceleration / Capitulation — A heavy-volume breakdown below the lower Bollinger Band takes price toward the next major support zone. Trigger: close below $185 with volume well above 10.57M. Target: $160-$172. Invalidation: a quick reclaim of $197 with a volume spike. (20% probability)
PRICE TARGETS
- Target Price: $190.00 (48-day horizon, about 7.8% below current)
- Expected Range: $170.00 to $208.00 (width $38, about 18.4% of current price, consistent with the 30-60 day guidance of 12-18%)
- Key Levels: Support at $185.14 (lower Bollinger Band), Resistance at $228.93 (SMA200D)
OVERALL BIAS
OVERALL BIAS: BEARISH - Price has broken below the SMA200D and sits under every EMA, SMA and VWAP. MACD is below its signal, CMF shows distribution, and ADX is rising to 25.2 with −DI (38.2) far above +DI (18.7), while RSI at 34.9 has not yet reached oversold extremes. A relief bounce toward $229 is possible, but the evidence favors a drift toward the $185 band and slightly below.
This is educational analysis and not financial advice.