EEM 48-day bearish forecast — Nov 1, 2026
- Bias: Bearish
- Timeframe: 48 days (made Nov 1, 2026, target date Dec 18, 2026)
- Price at analysis: $61.04
- Price target: $59.00
- Expected range: $54.50 – $65.00
- Result: Pending — graded after the close on Dec 18, 2026
Get a free AI analysis of EEM today
Analysis
TECHNICAL INDICATORS
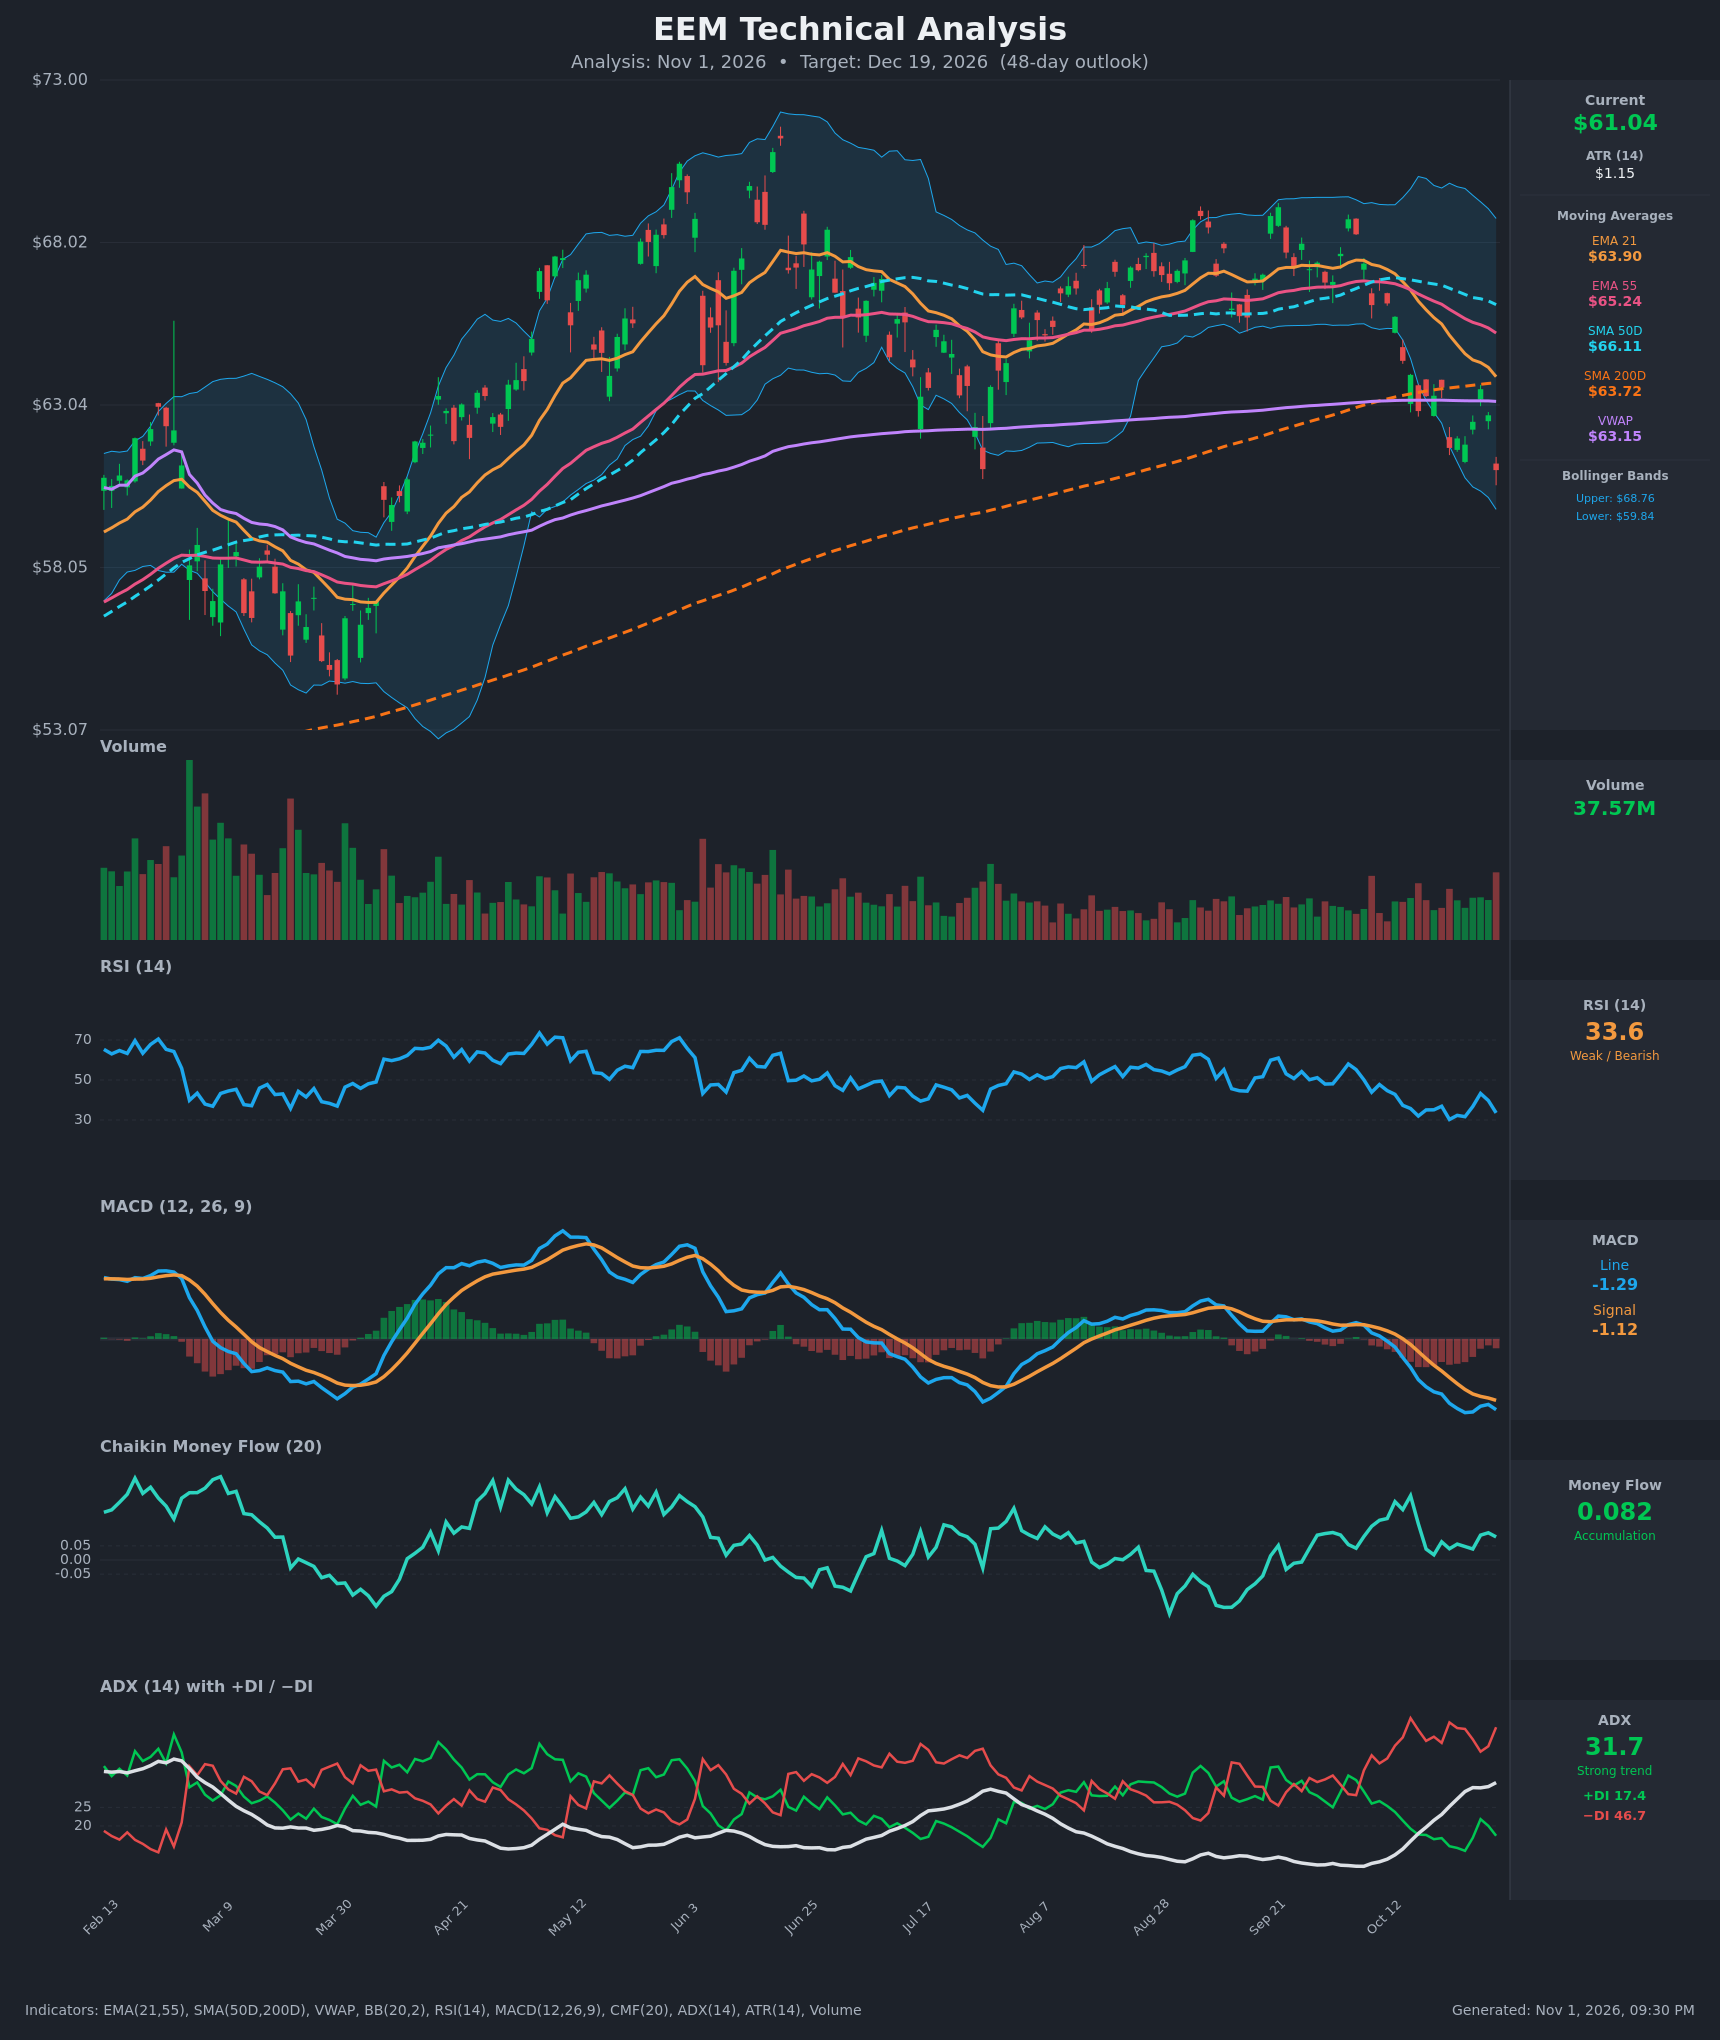
- RSI (14): 33.56, near oversold (<30 was touched on Oct 22 at 30.3). It bounced to 43 on Oct 28 and rolled over again. Momentum is weak, with lower highs on the bounce. [Bearish]
- 20 EMA (EMA 21): $63.90, with price at $61.04 about 4.5% below it. The EMA is sloping down and acts as overhead resistance. EMA21 is also below EMA55 ($65.24), so the short-term trend is down. [Bearish]
- MACD: Line -1.286 is below Signal -1.116, with a negative and widening histogram. The bearish crossover happened around Oct 14-15 and the line is making new lows. [Bearish]
- Bollinger Bands (20): Price is $61.04 against a lower band of $59.84, a middle band near $64.3, and an upper band of $68.76. Price sits in the lower third, about 0.8 ATR above the lower band. After a break from the range, price is "walking" the lower half. A band tag or brief overshoot is possible, and a bounce to the mid-band is also plausible. [Bearish]
- CMF (20): +0.082, a mild accumulation reading that has held above +0.05 even during the decline. Dip buying may be present, but the reading is modest and does not match the price weakness. [Accumulation]
- ADX (14): 31.7 and rising from 11 on Oct 12. −DI at 46.7 is far above +DI at 17.4. This is a strong, established downtrend. [Strong Trend – Bearish]
- Volume: 37.57M, roughly average to slightly above recent levels. The down days in the breakdown carried decent volume, and there is no capitulation spike. [Neutral to mildly bearish; no capitulation yet]
DIVERGENCES & TRENDS
- Moving averages: Price is below EMA21, EMA55, SMA50D ($66.11) and VWAP ($63.15). The SMA50D is rolling over. It remains above the SMA200D ($63.72), so there is no death cross yet, but the gap is closing. Price has fallen below the SMA200D, which is a long-term warning.
- Divergence: There is a mild bullish divergence in CMF, which stays positive while price makes lower lows. RSI made a marginal higher low (30.3 → 31.7 → 33.6 is not confirmed yet). MACD is still making new lows, so there is no momentum divergence.
- Trend: The Sep/Oct range top near $68-69 failed, and price broke down through the $63.5 SMA200D/VWAP zone. ADX and −DI are accelerating.
- Crossovers: The bearish MACD cross is intact. EMA21 crossed below EMA55 in mid-October. A death cross (SMA50D below SMA200D) is possible within weeks if the decline continues.
CHART PATTERNS
- The range from roughly July to October looks like a broad consolidation, with a Bearish Triple Top or rectangle-like top near $68-69 and support around $63. The recent break below $63 resolves it to the downside, with a measured move toward about $57-58 (range height of roughly $5-6 projected below $63).
- Price since the break is stair-stepping lower inside a descending channel, which resembles a Bearish Flag on the minor bounces (Oct 28 high of $63.52).
- The $53-58 zone from March-April is the next major demand area, near the rising SMA200D path.
- Counter-pattern: a Bullish Falling Wedge is not clearly developing. The decline is steep with no contraction.
POTENTIAL SCENARIOS
- Scenario 1: Bearish Continuation Toward Measured Move — The downtrend continues, with the bounce to the $63-64 EMA21/SMA200D zone rejected. Price slides through the lower band toward the prior breakout base. Trigger: close below $59.80 (the lower band and Oct low area). Target: $57.50-$58.50. Invalidation: daily close above $64.50 (above EMA21 and the SMA200D). (50% probability)
- Scenario 2: Neutral Oversold Consolidation — The market stabilizes around $59.50-$63.50 as RSI resets and CMF accumulation holds, with price chopping below the declining EMA21. Trigger: holding the $59.80 lower band with RSI above 30. Target: $60-$63. Invalidation: close below $59 or above $64.5. (25% probability)
- Scenario 3: Bullish Oversold Reversal — Dip buyers lift price back above the SMA200D/VWAP. Trigger: close above $63.90 (EMA21) with a MACD histogram turn. Target: $65.20 (EMA55), then $66.10. Invalidation: close back below $61. (25% probability)
PRICE TARGETS
- Target Price: $59.00 (48 days, about -3.3%)
- Expected Range: $54.50 to $65.00 (width $10.50, about 17.2% of current price, in line with the 30-60 day guidance of 12-18%)
- Key Levels: Support at $59.80 (lower Bollinger Band), Resistance at $63.72 (SMA200D, with EMA21 at $63.90 just above)
OVERALL BIAS
OVERALL BIAS: BEARISH - The trend is strong and down, with ADX at 31.7, −DI at 46.7 far above +DI, a bearish MACD and price below all key moving averages. The range breakdown projects toward $57-58, and the positive CMF only tempers the magnitude of the decline.
This is educational analysis and not financial advice.