GLD 48-day bearish forecast — Nov 1, 2026
- Bias: Bearish
- Timeframe: 48 days (made Nov 1, 2026, target date Dec 18, 2026)
- Price at analysis: $355.78
- Price target: $346.00
- Expected range: $322.00 – $376.00
- Result: Pending — graded after the close on Dec 18, 2026
Get a free AI analysis of GLD today
Analysis
TECHNICAL INDICATORS
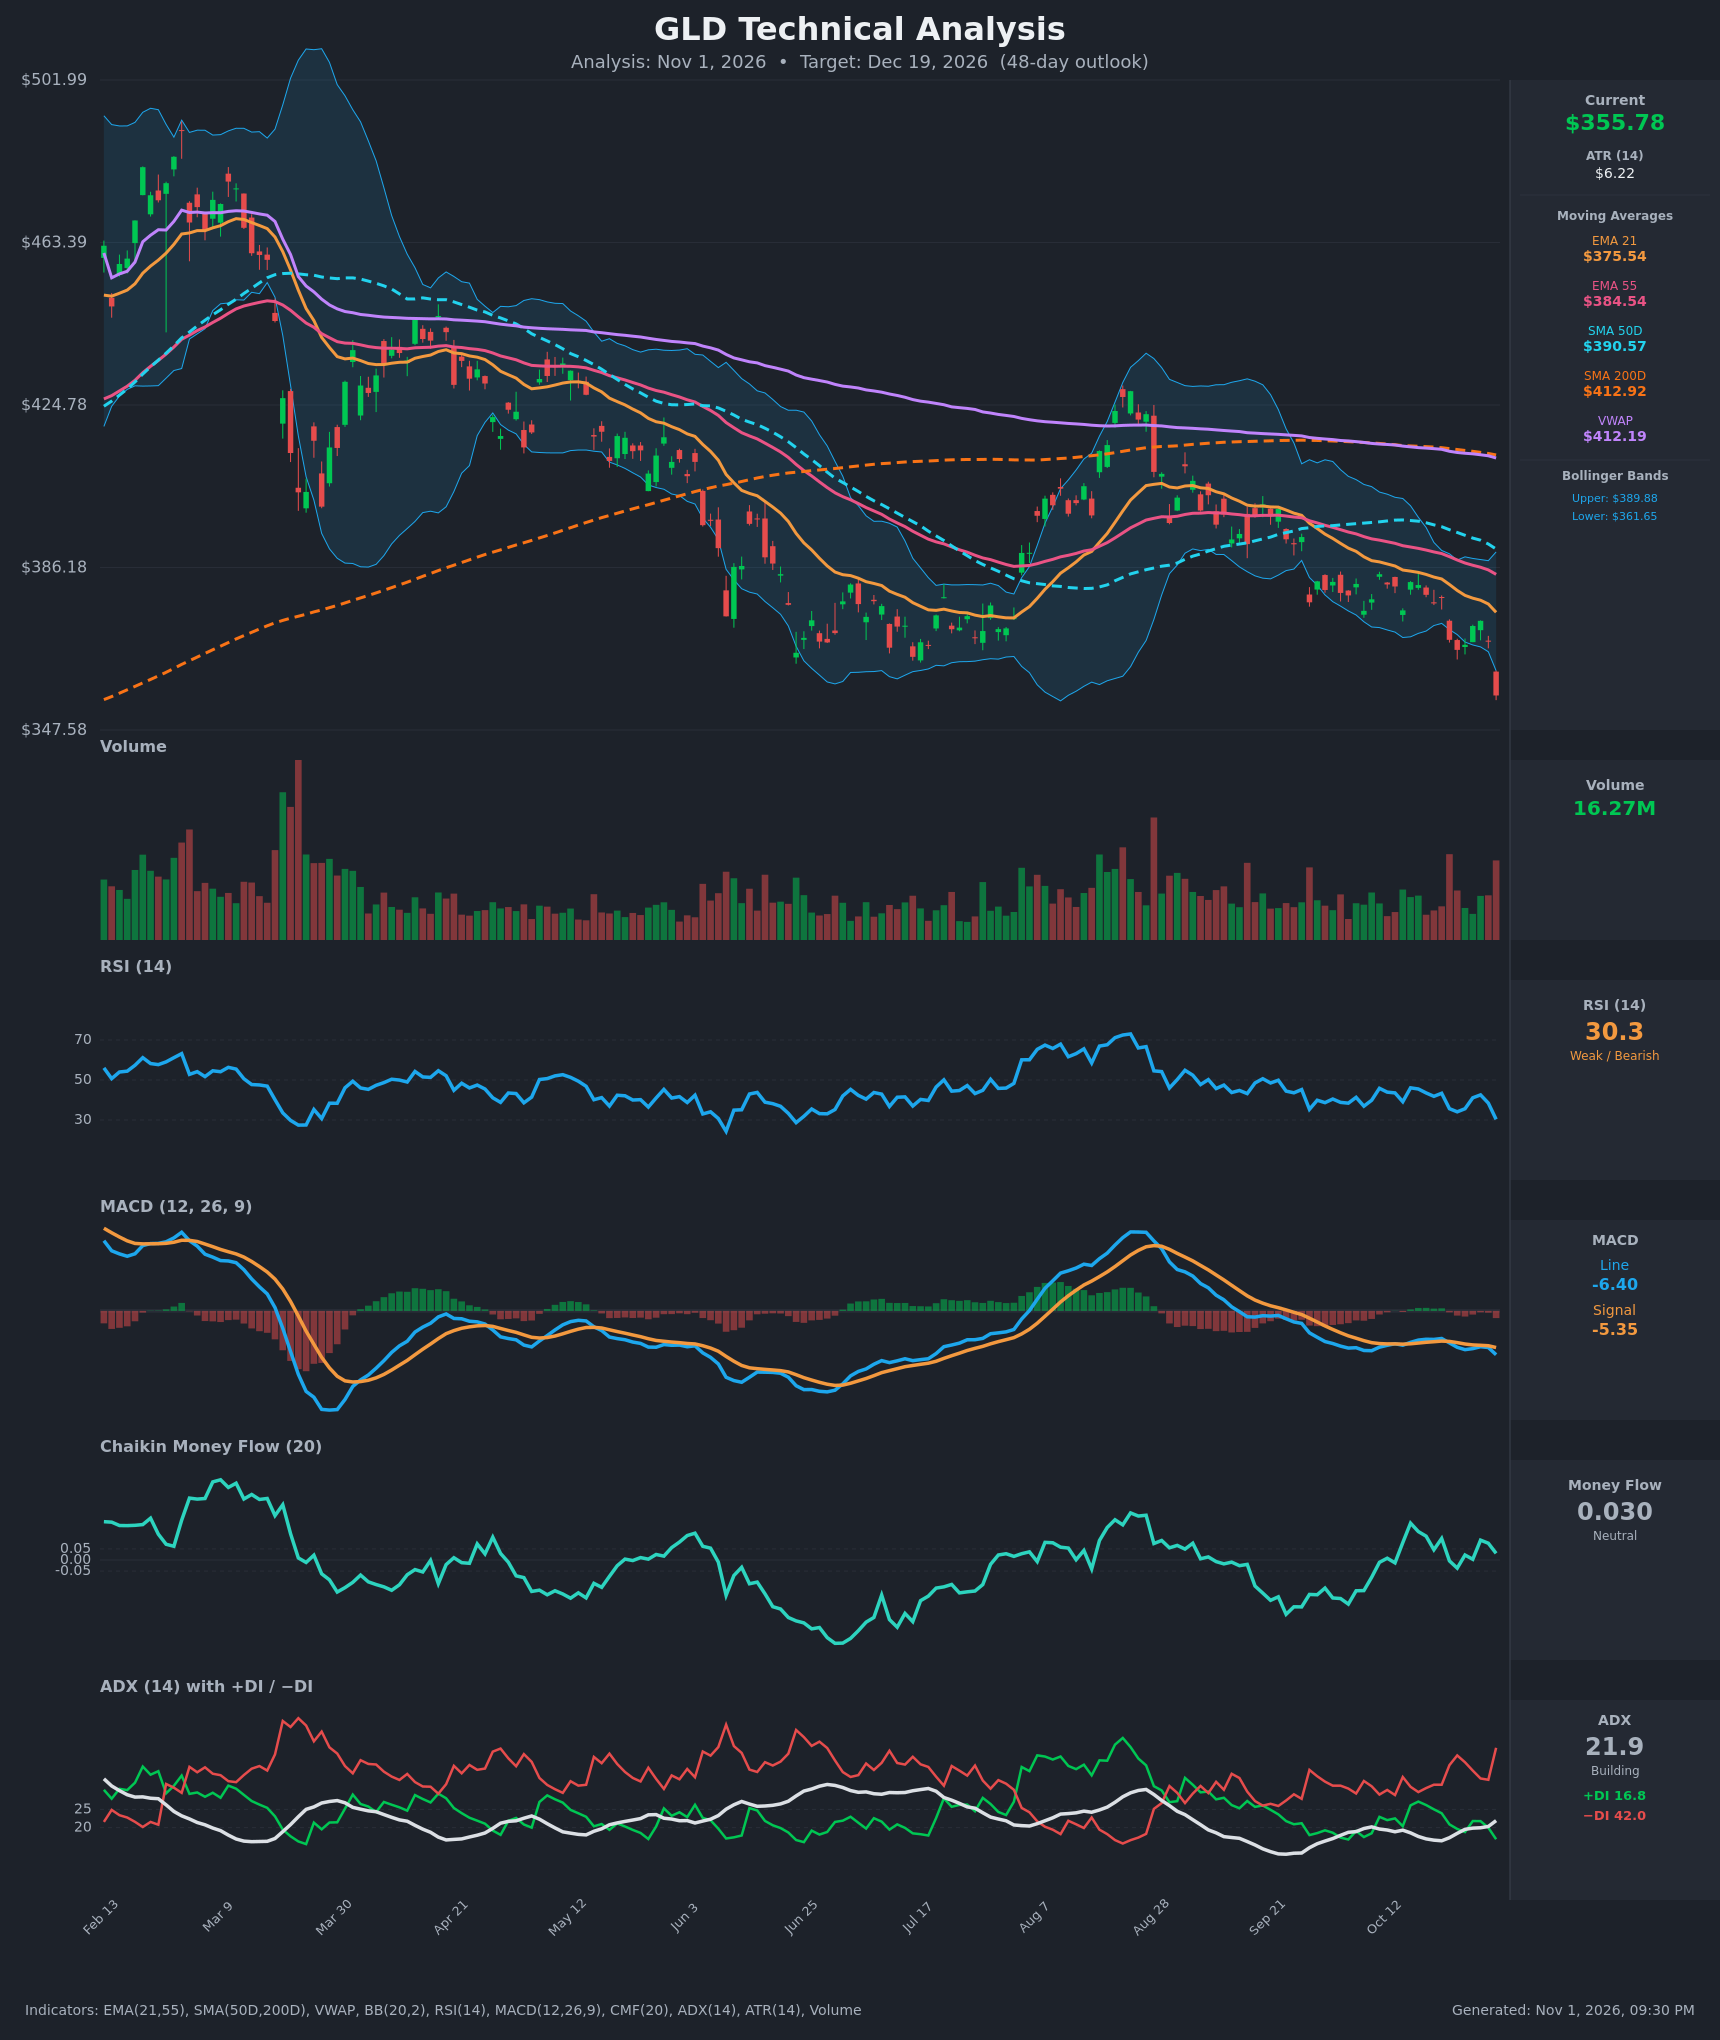
- RSI (14): 30.32, down from 38.5 the prior day and 42.6 on Oct 28. It sits at the edge of oversold, and momentum is falling sharply. The reading is near 30 but has not yet made a deep oversold extreme, so a bounce is possible but not confirmed. [Bearish]
- 20 EMA: The 21 EMA is $375.54 and price ($355.78) is about 5.3% below it. The EMA is falling every day and acts as overhead resistance. [Bearish]
- MACD: Line -6.395 is below signal -5.347, a histogram of about -1.05. The line crossed under the signal on Oct 22 and the gap widened on Oct 30. Both lines are negative and falling. [Bearish]
- Bollinger Bands (20): Upper $389.88, lower $361.65. Price closed about $5.9 below the lower band, a band-walk breakdown. This is a stretched, short-term oversold condition, but in a downtrend it shows strong selling pressure rather than a reversal signal. [Bearish]
- CMF (20): 0.030, between -0.05 and +0.05, so money flow is neutral. It has hovered slightly positive during the decline, so there is no heavy distribution yet. It does not confirm the price weakness, which is a mild caution for the bears. [Neutral]
- ADX (14): 21.9 and rising from 16.4, with +DI 16.8 and -DI 42.0. Bears are clearly in control with a wide DI spread. The trend is just emerging, and a move above 25 would confirm a strong downtrend. [Weak but Building Trend – Bearish]
- Volume: 16.27M, the highest bar on the right side of the chart, on a large red candle (-3.5%). Heavy volume on a breakdown suggests real selling rather than drift. It could also hint at a short-term capitulation. [Bearish – high-volume breakdown]
DIVERGENCES & TRENDS
- Moving average structure: Fully bearish stack. Price ($355.78) < EMA21 ($375.54) < EMA55 ($384.54) < SMA50 ($390.57) < SMA200 ($412.92), with VWAP at $412.19. The SMA50 is already below the SMA200 (death cross in place), and the EMA21 has been below the EMA55 throughout the recent data.
- MACD: The bearish crossover from Oct 22 is widening, with no sign of a bullish turn.
- RSI: Making lower highs (46 → 43 → 42.6) and now testing 30. There is no bullish divergence yet. The RSI low of 34.1 on Oct 23 was followed by a lower price low today, and RSI is at a lower low (30.3 vs 34.1), so momentum confirms price.
- CMF: Neutral and not confirming the selling. This is a minor non-confirmation that argues for a possible relief bounce.
- DI: -DI has stayed above +DI the whole period, spiking to 42 today. ADX rising from below 20 signals a trend gaining strength.
- Price and bands: Price has pushed below the lower Bollinger Band and below the prior swing lows near $366–$367 (Oct 23) and the sub-$362 zone.
CHART PATTERNS
- Bearish Flag / Rectangle breakdown: From mid-October, price consolidated in a roughly $366–$383 range with slightly lower highs, then broke down on heavy volume. This resembles the Bearish Flag/Pennant continuation pattern in the reference diagram. A measured move from the flag top (~$383) projects toward $340–$350, which aligns with the chart's lower area near $347.58.
- Broader downtrend: The lower highs since the Aug rally (~$435) and the failure at the SMA200/VWAP zone (~$412) confirm a larger bearish structure. A bounce into the $366–$376 zone would be a retest of broken support.
- Caveat: The prior-range lows around $350–$362 (Jun–Jul and early Aug) form a support area. A sustained hold there would shift this into a Double/Triple Bottom-type base, but that is not confirmed.
POTENTIAL SCENARIOS
- Scenario 1: Bearish Trend Continuation — Price follows through on the breakdown, with ADX moving above 25 and -DI staying dominant. Rallies stall at the broken support and the falling EMA21. Trigger: daily close below $350 or failure to reclaim $366. Target: $346 (base case), with an extension to $330–$335 if the $347.58 area breaks. Invalidation: daily close above $376 (EMA21), which would indicate the breakdown has failed. (50% probability)
- Scenario 2: Bullish Oversold Relief Bounce — RSI near 30, price far below the lower Bollinger Band, and neutral CMF support a mean-reversion bounce back into the band and moving averages. Trigger: bullish MACD histogram turn and a close above $367.50. Target: $375–$385 (EMA21 to EMA55). Invalidation: close below $345. (35% probability)
- Scenario 3: Neutral Range-Bound Base — Price chops between prior-low support and the lower band area without a decisive break. Trigger: ADX stalls below 22 and price oscillates. Target: $350–$368. Invalidation: close outside $343–$372. (15% probability)
PRICE TARGETS
- Target Price: $346.00 (48-day horizon, ~Dec 19)
- Expected Range: $322.00 to $376.00 (width $54, about 15.2% of current price, consistent with the 30–60 day guidance)
- Key Levels: Support at $345.00, Resistance at $367.50
OVERALL BIAS
OVERALL BIAS: BEARISH - Price has broken below the lower Bollinger Band on heavy volume, sits below every moving average with a death cross in place, and has a bearish MACD cross, falling RSI, and a −DI/+DI spread of 42 vs 17. The oversold RSI and neutral CMF raise the chance of a relief bounce, but the trend evidence favors further downside over 48 days.
This is educational analysis and not financial advice.