MARA 48-day bearish forecast — Nov 1, 2026
- Bias: Bearish
- Timeframe: 48 days (made Nov 1, 2026, target date Dec 18, 2026)
- Price at analysis: $6.77
- Price target: $6.35
- Expected range: $5.80 – $6.95
- Result: Pending — graded after the close on Dec 18, 2026
Get a free AI analysis of MARA today
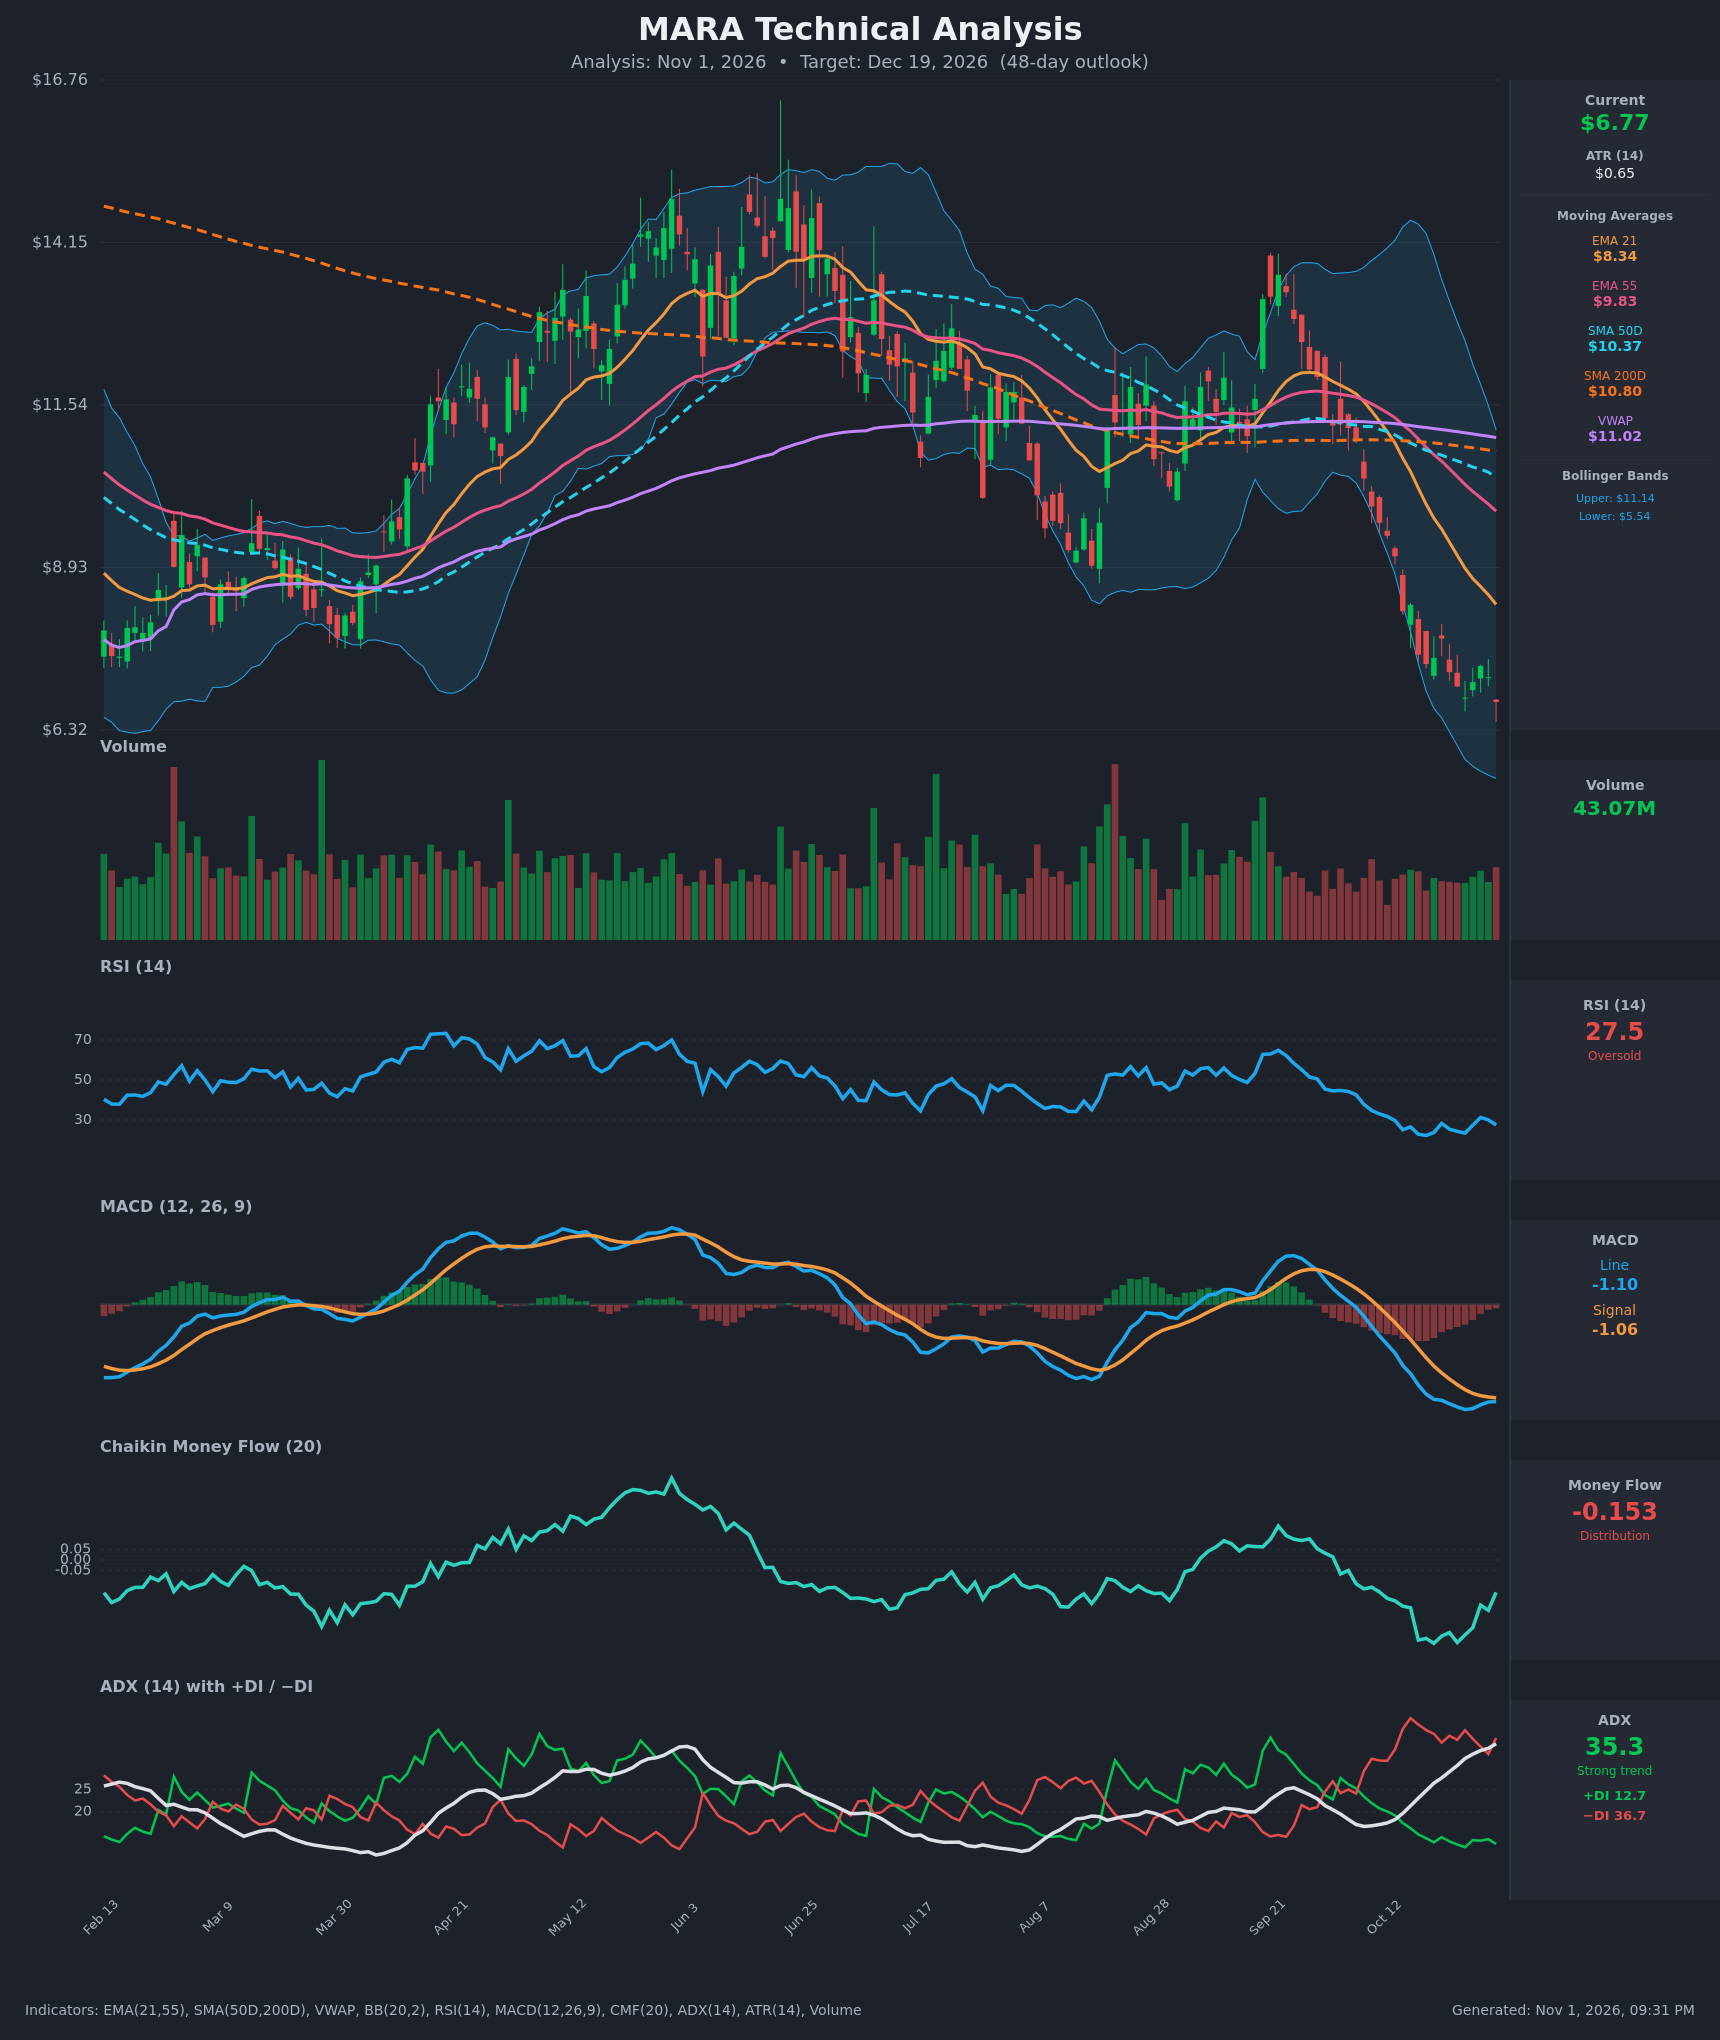
Analysis
TECHNICAL INDICATORS
- RSI (14): 27.52, oversold. It has been below 30 for most of the last two weeks, with a low of 22.3 on Oct 19. The bounce to 31.3 on Oct 28 failed, and RSI has rolled over again as price made a new closing low. Momentum is weak, though the oversold reading raises the risk of a relief rally. [Bearish]
- 20 EMA: The 21 EMA is $8.34, about 23% above price at $6.77. It has fallen every day in the table, from $11.11 to $8.34. EMA21 is also below EMA55 ($9.83), so short-term trend is firmly down and the EMAs act as heavy overhead resistance. [Bearish]
- MACD: Line -1.098 vs signal -1.057, histogram about -0.04. The line has been below the signal since early October and sits deep in negative territory. The histogram has shrunk from about -0.28 to -0.04, so downside momentum is fading and a bullish crossover is close. That has not happened yet, and price just made a new low. [Bearish]
- Bollinger Bands (20): Upper $11.14, lower $5.54, with the midline near $8.34. Price at $6.77 is in the lower third of the bands. The bands are wide, which means high volatility. Price has hugged the lower half of the bands during the decline. The lower band at $5.54 is the next volatility-based support. [Bearish]
- CMF (20): -0.153, which is distribution. It has improved from a trough near -0.39 (Oct 20–23), so selling pressure is easing, but it is still well below the -0.05 threshold. Buyers have not taken control. [Distribution]
- ADX (14): 35.3 and rising steadily from 17.4 on Oct 12. +DI is 12.7 and −DI is 36.7, so bears dominate by a wide margin. This is a strong, accelerating downtrend with no sign of exhaustion in the trend-strength reading. [Strong Trend – Bearish]
- Volume: 43.07M. Volume is about average, with no capitulation spike near the lows. The sell-off has come on steady, moderate volume. Without a climactic volume flush, a durable bottom is less likely. [Neutral-to-Bearish]
DIVERGENCES & TRENDS
- MACD histogram: It is converging toward zero while price makes new lows. This is early momentum improvement, not a confirmed bullish divergence.
- RSI: The Oct 19 low was 22.3 with price at $7.38. Today's RSI is 27.5 with price at a lower $6.77, a mild bullish RSI divergence. The Oct 26 low (23.4) and today's (27.5) show the same pattern. It is not yet confirmed by a price breakout.
- CMF: It has improved from -0.39 to -0.15 while price fell to new lows. This is a mild bullish divergence in money flow, but it is still in distribution territory.
- Moving averages:
- Price is far below the SMA200D ($10.80), SMA50D ($10.37), EMA55 ($9.83), EMA21 ($8.34) and VWAP ($11.02).
- The SMA50D crossed below the SMA200D in mid-October (a death cross), a major bearish signal.
- EMA21 is below EMA55.
- ADX/DI: −DI has been above +DI throughout, and ADX is above 25 and rising, so the downtrend is accelerating.
- Price structure: Lower highs and lower lows since the Sep 21 peak near $14. Today's close at $6.77 undercuts the Oct 26 close of $6.84.
CHART PATTERNS
- Bearish continuation setup: Price has spent Oct 26–30 in a tight $6.84–$7.35 band after a steep drop from about $14. This resembles a small Bearish Flag/Pennant. Today's close at $6.77 is a break below that band, which would confirm continuation.
- Measured-move caution: The flagpole is very large, so a full measured move would be unrealistic. The more probable path is a grind lower toward the $5.54 lower band.
- Larger structure: The rally from about $7.40 to $14 and back down is a rounded top that has completed. The death cross confirms the damage. The failed Aug–Sep bounce also produced a lower high at about $14 versus the $15+ peak.
- Alternative (Bullish Falling Wedge): A falling wedge or double-bottom reading is possible only if price holds around $6.50–$6.80 and reclaims $7.35. The chart does not support that yet.
POTENTIAL SCENARIOS
- Scenario 1: Bearish Trend Continuation — Bears stay in control (−DI 36.7 vs +DI 12.7, ADX 35 and rising). Price breaks the flag low near $6.77–$6.84 and drifts toward the lower Bollinger Band, with only weak relief bounces capped by the falling EMA21. Trigger: daily close below $6.60 on average-or-higher volume. Target: $6.35 by Dec 19, with a possible extension to $5.54. Invalidation: daily close above $7.35 with MACD bullish crossover and CMF above -0.05. (50% probability)
- Scenario 2: Bullish Oversold Relief Rally — RSI is oversold with bullish RSI/CMF divergences and a converging MACD histogram, so a mean-reversion bounce is plausible. Trigger: MACD bullish crossover and a close above $7.35. Target: $8.30–$8.40 (EMA21), a retest of falling resistance. Invalidation: close back below $6.50. (35% probability)
- Scenario 3: Neutral Basing Range — Price stabilizes after the selloff and chops between $6.00 and $7.40 as the oversold condition resolves through time rather than price. Trigger: ADX rolling over from 35 and holding above $6.40. Target: about $6.80. Invalidation: close outside $6.00–$7.40. (15% probability)
PRICE TARGETS
- Target Price: $6.35 (48-day horizon, Dec 19, 2026)
- Expected Range: $5.80 to $6.95 (width $1.15, about 17% of the current price, consistent with the 30–60 day guidance)
- Key Levels: Support at $5.54 (lower Bollinger Band), Resistance at $7.35 (recent swing high / flag top)
OVERALL BIAS
OVERALL BIAS: BEARISH - The downtrend is strong and accelerating (ADX 35.3, −DI 36.7 vs +DI 12.7). Price is far below every moving average, the death cross is in place, CMF shows distribution, and today's close broke below the recent consolidation. The oversold RSI and fading MACD momentum raise the odds of relief bounces, but they have not produced a trend change.
This is educational analysis and not financial advice.