NIO 48-day bearish forecast — Nov 1, 2026
- Bias: Bearish
- Timeframe: 48 days (made Nov 1, 2026, target date Dec 18, 2026)
- Price at analysis: $3.21
- Price target: $2.95
- Expected range: $2.70 – $3.25
- Result: Pending — graded after the close on Dec 18, 2026
Get a free AI analysis of NIO today
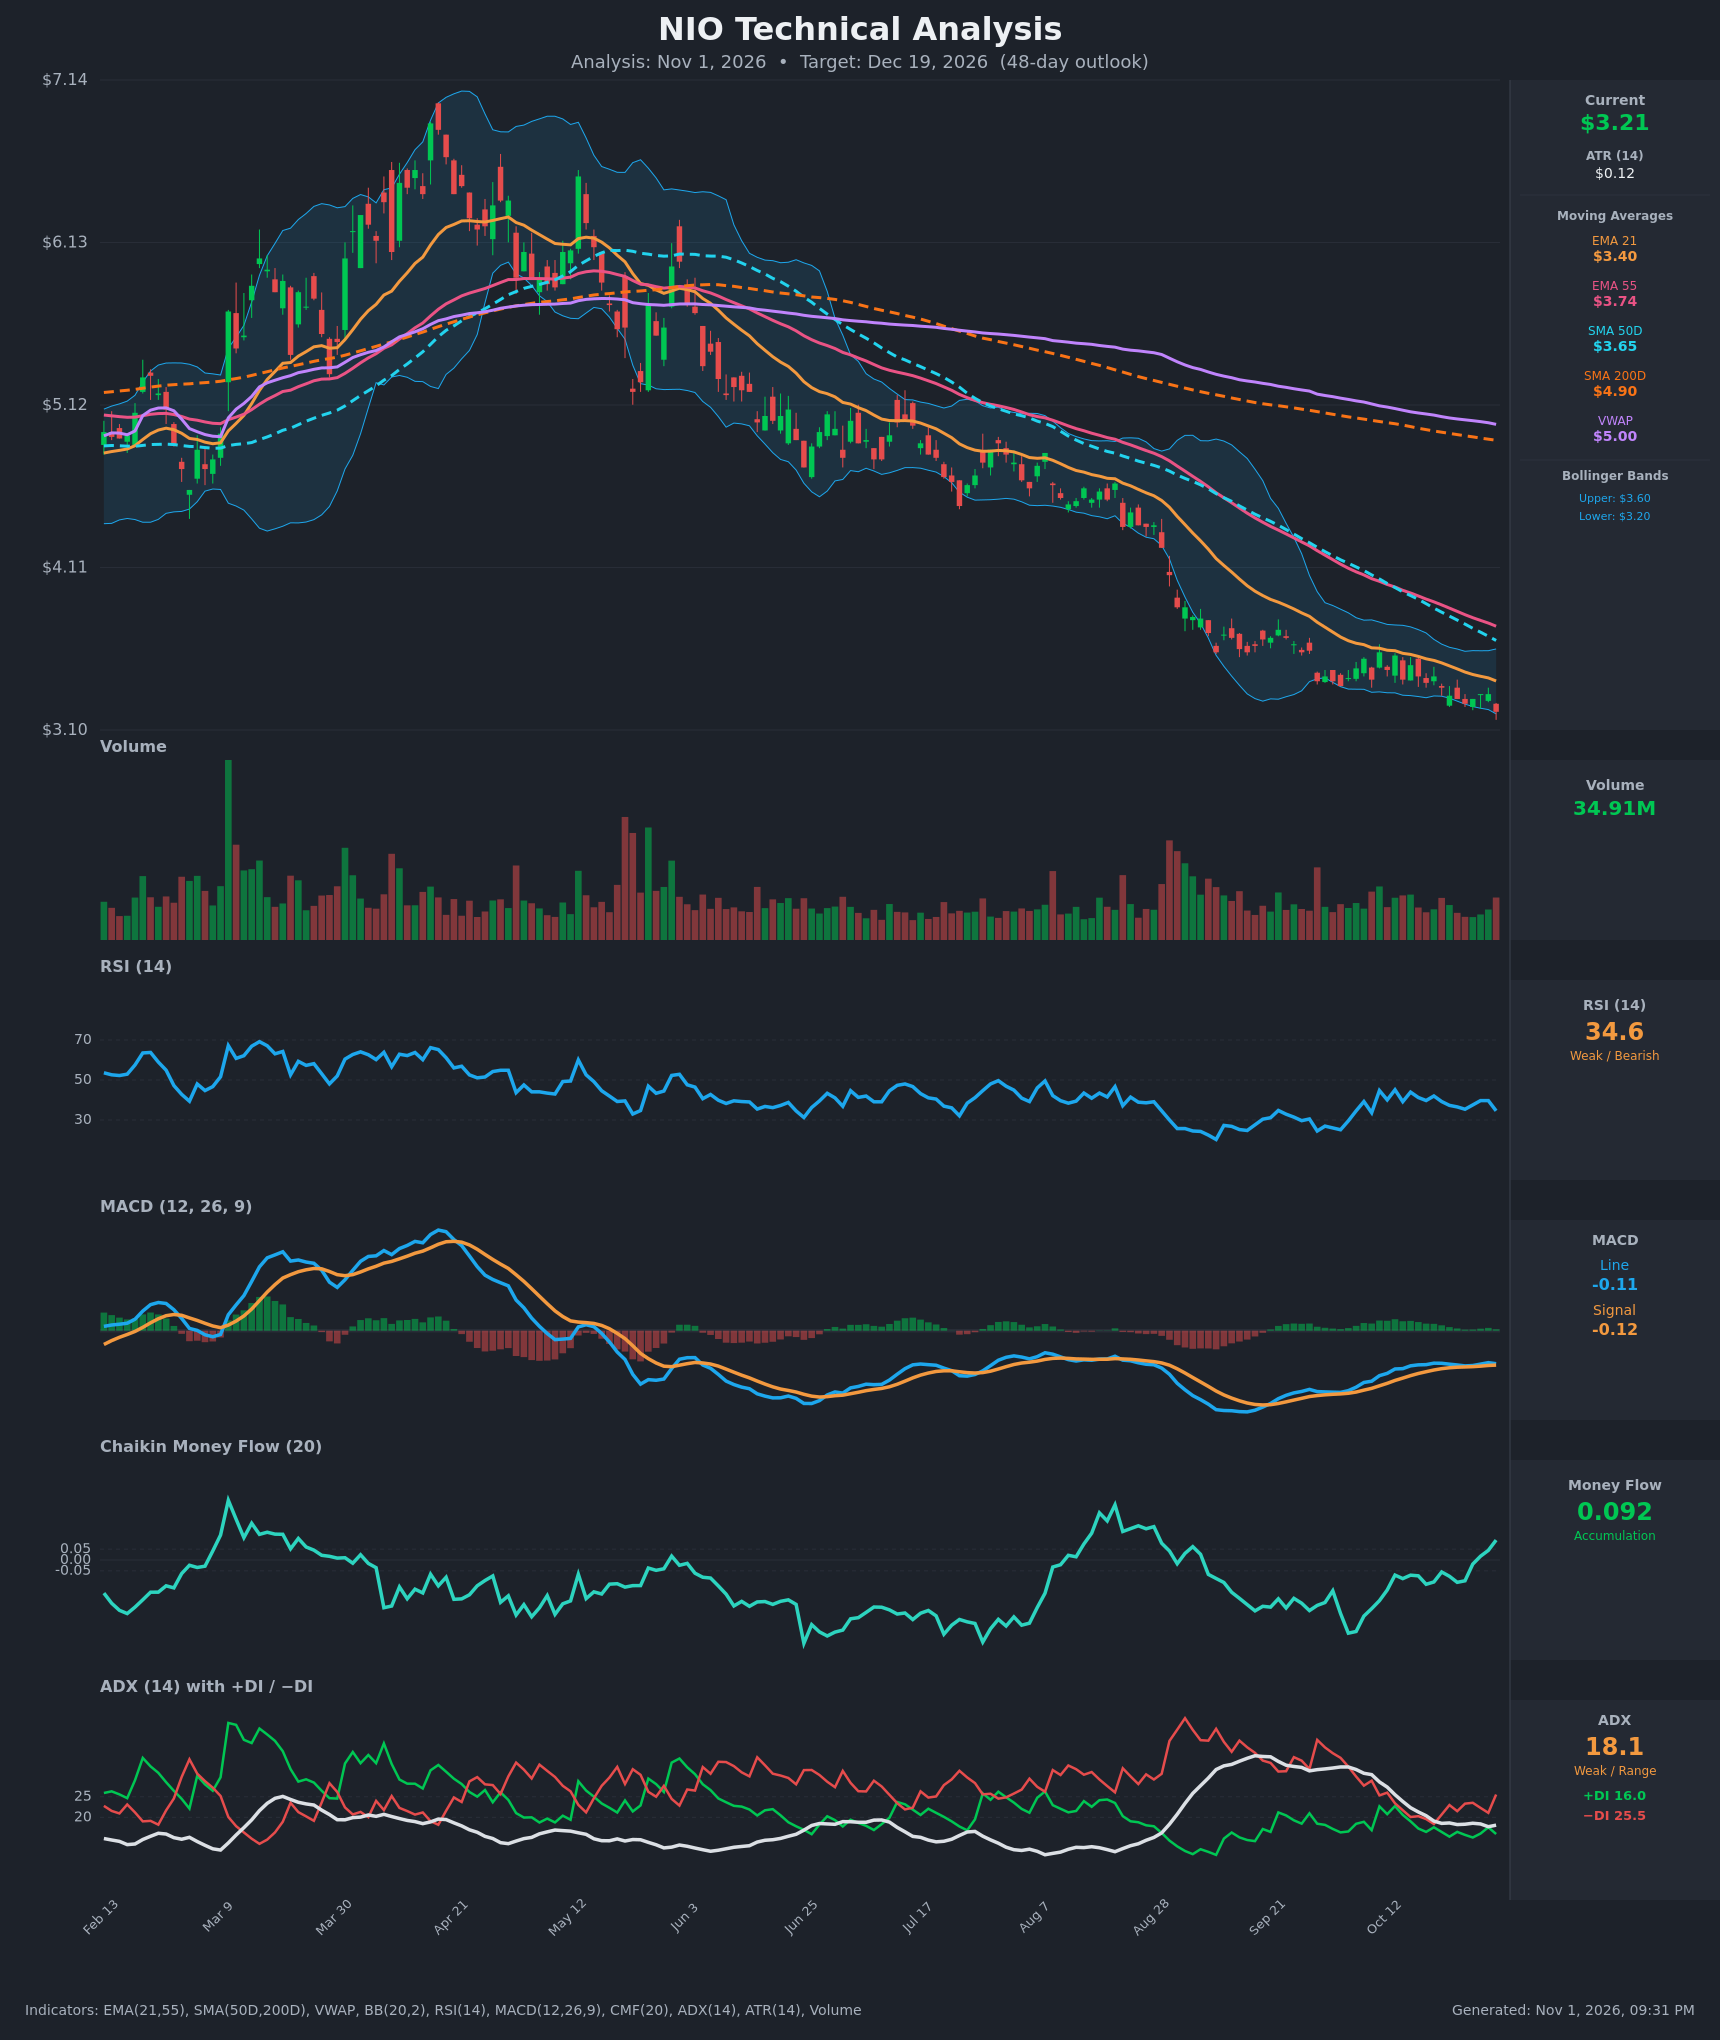
Analysis
TECHNICAL INDICATORS
- RSI (14): 34.60, down from about 39.7 two sessions ago and approaching oversold (<30). It has stayed in a 35-45 band since late Aug and failed to reclaim 50, which is the pattern of a persistent downtrend. Momentum is weak but not yet washed out. [Bearish]
- 20 EMA (EMA 21): $3.4017. Price at $3.21 is about 5.6% below it, and the EMA keeps sloping down. It was tested as resistance several times in October, and it is the first overhead hurdle on any bounce. EMA 21 is also well below EMA 55 ($3.74), so the bearish EMA stack is intact. [Bearish]
- MACD: Line -0.1119 vs Signal -0.1166, so the line is marginally above the signal and the histogram is barely positive (+0.005). The line has flattened and rolled back down over the last few sessions, and the histogram is collapsing toward a bearish re-cross. Both lines sit below zero. [Neutral]
- Bollinger Bands (20): Upper $3.60, lower $3.197. Price at $3.21 sits at the lower band, and the bands are narrowing after the August-September expansion. Walking the lower band is a sign of trend persistence. A mean-reversion bounce toward the $3.40 midline is possible. [Bearish]
- CMF (20): +0.092, up from -0.139 on Oct 12 and above the +0.05 threshold. Buying pressure is increasing even as price makes new lows. This is the main bullish counterweight, but it has not yet shown up in price. [Accumulation]
- ADX (14): 18.1 (weak/range-bound), down from 27 on Oct 12. −DI at 25.5 is well above +DI at 16.0, so sellers still control direction. The trend is fading in strength but not reversing. [Weak Trend, Bearish direction]
- Volume: 34.91M, which is moderate and below the August spike volume. Volume has stayed muted on recent new lows. That suggests a lack of panic selling, but also no strong buying. [Neutral to mildly bearish]
DIVERGENCES & TRENDS
- CMF vs price: CMF has climbed from -0.139 to +0.092 over 14 sessions while price fell from $3.47 to $3.21. This is a bullish divergence that hints at accumulation or short covering. It is unconfirmed until price breaks above $3.40.
- MACD: The line is rising slowly against a falling price. The Oct 30 reading is already turning down, and a bearish signal-line cross is imminent.
- RSI: It has made no new lows (the Aug trough was in the low 20s). It is not oversold now, so there is room for more downside.
- Moving averages: A death cross has already occurred (SMA50D $3.65 below SMA200D $4.90). EMA 21 < EMA 55 < SMA50D < SMA200D < VWAP. Price sits below every average and VWAP ($5.00), which is a fully bearish structure.
- ADX/DI: ADX has fallen from the Aug-Sep peak (above 30) toward 18. −DI crossed back above +DI on Oct 21 and widened again on Oct 30. This shows trend exhaustion with bears still in control.
- Trend: The stock has fallen from about $7.00 in April to $3.21, a lower-high, lower-low sequence.
CHART PATTERNS
- Bearish Flag/Descending channel: After the sharp August-September drop, price consolidated in a shallow, slightly rising or sideways channel at $3.35-$3.65. It then broke to the downside (Oct 30 close $3.21, below the recent range). This matches the Bearish Flag Pattern in the reference. The measured move of the prior leg suggests further downside, but the target is likely partial given the oversold bands.
- Bearish continuation context: The overall structure is a long-term descending channel. There is no reversal pattern (no double bottom or inverted H&S) yet.
- Watch for: A Bullish Falling Wedge or Double Bottom would only form if price stabilizes in the $3.00-$3.20 area and CMF accumulation persists. Neither is confirmed.
- Targets: ATR is $0.1229, so a 48-day trend move of roughly 2 ATR-weeks suggests a push toward $2.95-$3.00 in the base case.
POTENTIAL SCENARIOS
- Scenario 1: Bearish Trend Continuation — Price breaks below the lower Bollinger Band and the flag base, with MACD re-crossing negative and −DI staying above +DI. Sellers grind lower in a weak-ADX drift. Trigger: daily close below $3.15 with MACD below signal. Target: $2.95, with an extension to $2.75. Invalidation: daily close above $3.40 (EMA 21). (50% probability)
- Scenario 2: Bullish Relief Bounce — The CMF divergence and near-oversold RSI produce a mean-reversion rally toward the Bollinger midline and EMA 21, then to the SMA50D area. Trigger: close above $3.30 with RSI back above 45 and CMF holding >0.05. Target: $3.40-$3.65. Invalidation: close back below $3.10. (35% probability)
- Scenario 3: Neutral Base Formation — Price chops between $3.05 and $3.35 as ADX stays below 20 and selling exhausts. Trigger: repeated holds above $3.05 with narrowing Bollinger Bands. Target: $3.15-$3.25. Invalidation: a break outside $3.00-$3.40. (15% probability)
PRICE TARGETS
- Target Price: $2.95 (48-day timeframe, Dec 19, 2026)
- Expected Range: $2.70 to $3.25 (width $0.55, about 17% of the current price, which fits the 30-60 day guidance of 12-18%)
- Key Levels: Support at $3.00, Resistance at $3.40
OVERALL BIAS
OVERALL BIAS: BEARISH - Price sits below every moving average and VWAP, after a death cross, with −DI well above +DI and the stock breaking down from a bearish flag at the lower Bollinger Band. The rising CMF and near-oversold RSI raise the odds of a relief bounce, but they do not yet offset the dominant downtrend.
This is educational analysis and not financial advice.