QUBT 48-day bearish forecast — Nov 1, 2026
- Bias: Bearish
- Timeframe: 48 days (made Nov 1, 2026, target date Dec 18, 2026)
- Price at analysis: $6.60
- Price target: $6.05
- Expected range: $5.20 – $7.20
- Result: Pending — graded after the close on Dec 18, 2026
Get a free AI analysis of QUBT today
Analysis
TECHNICAL INDICATORS
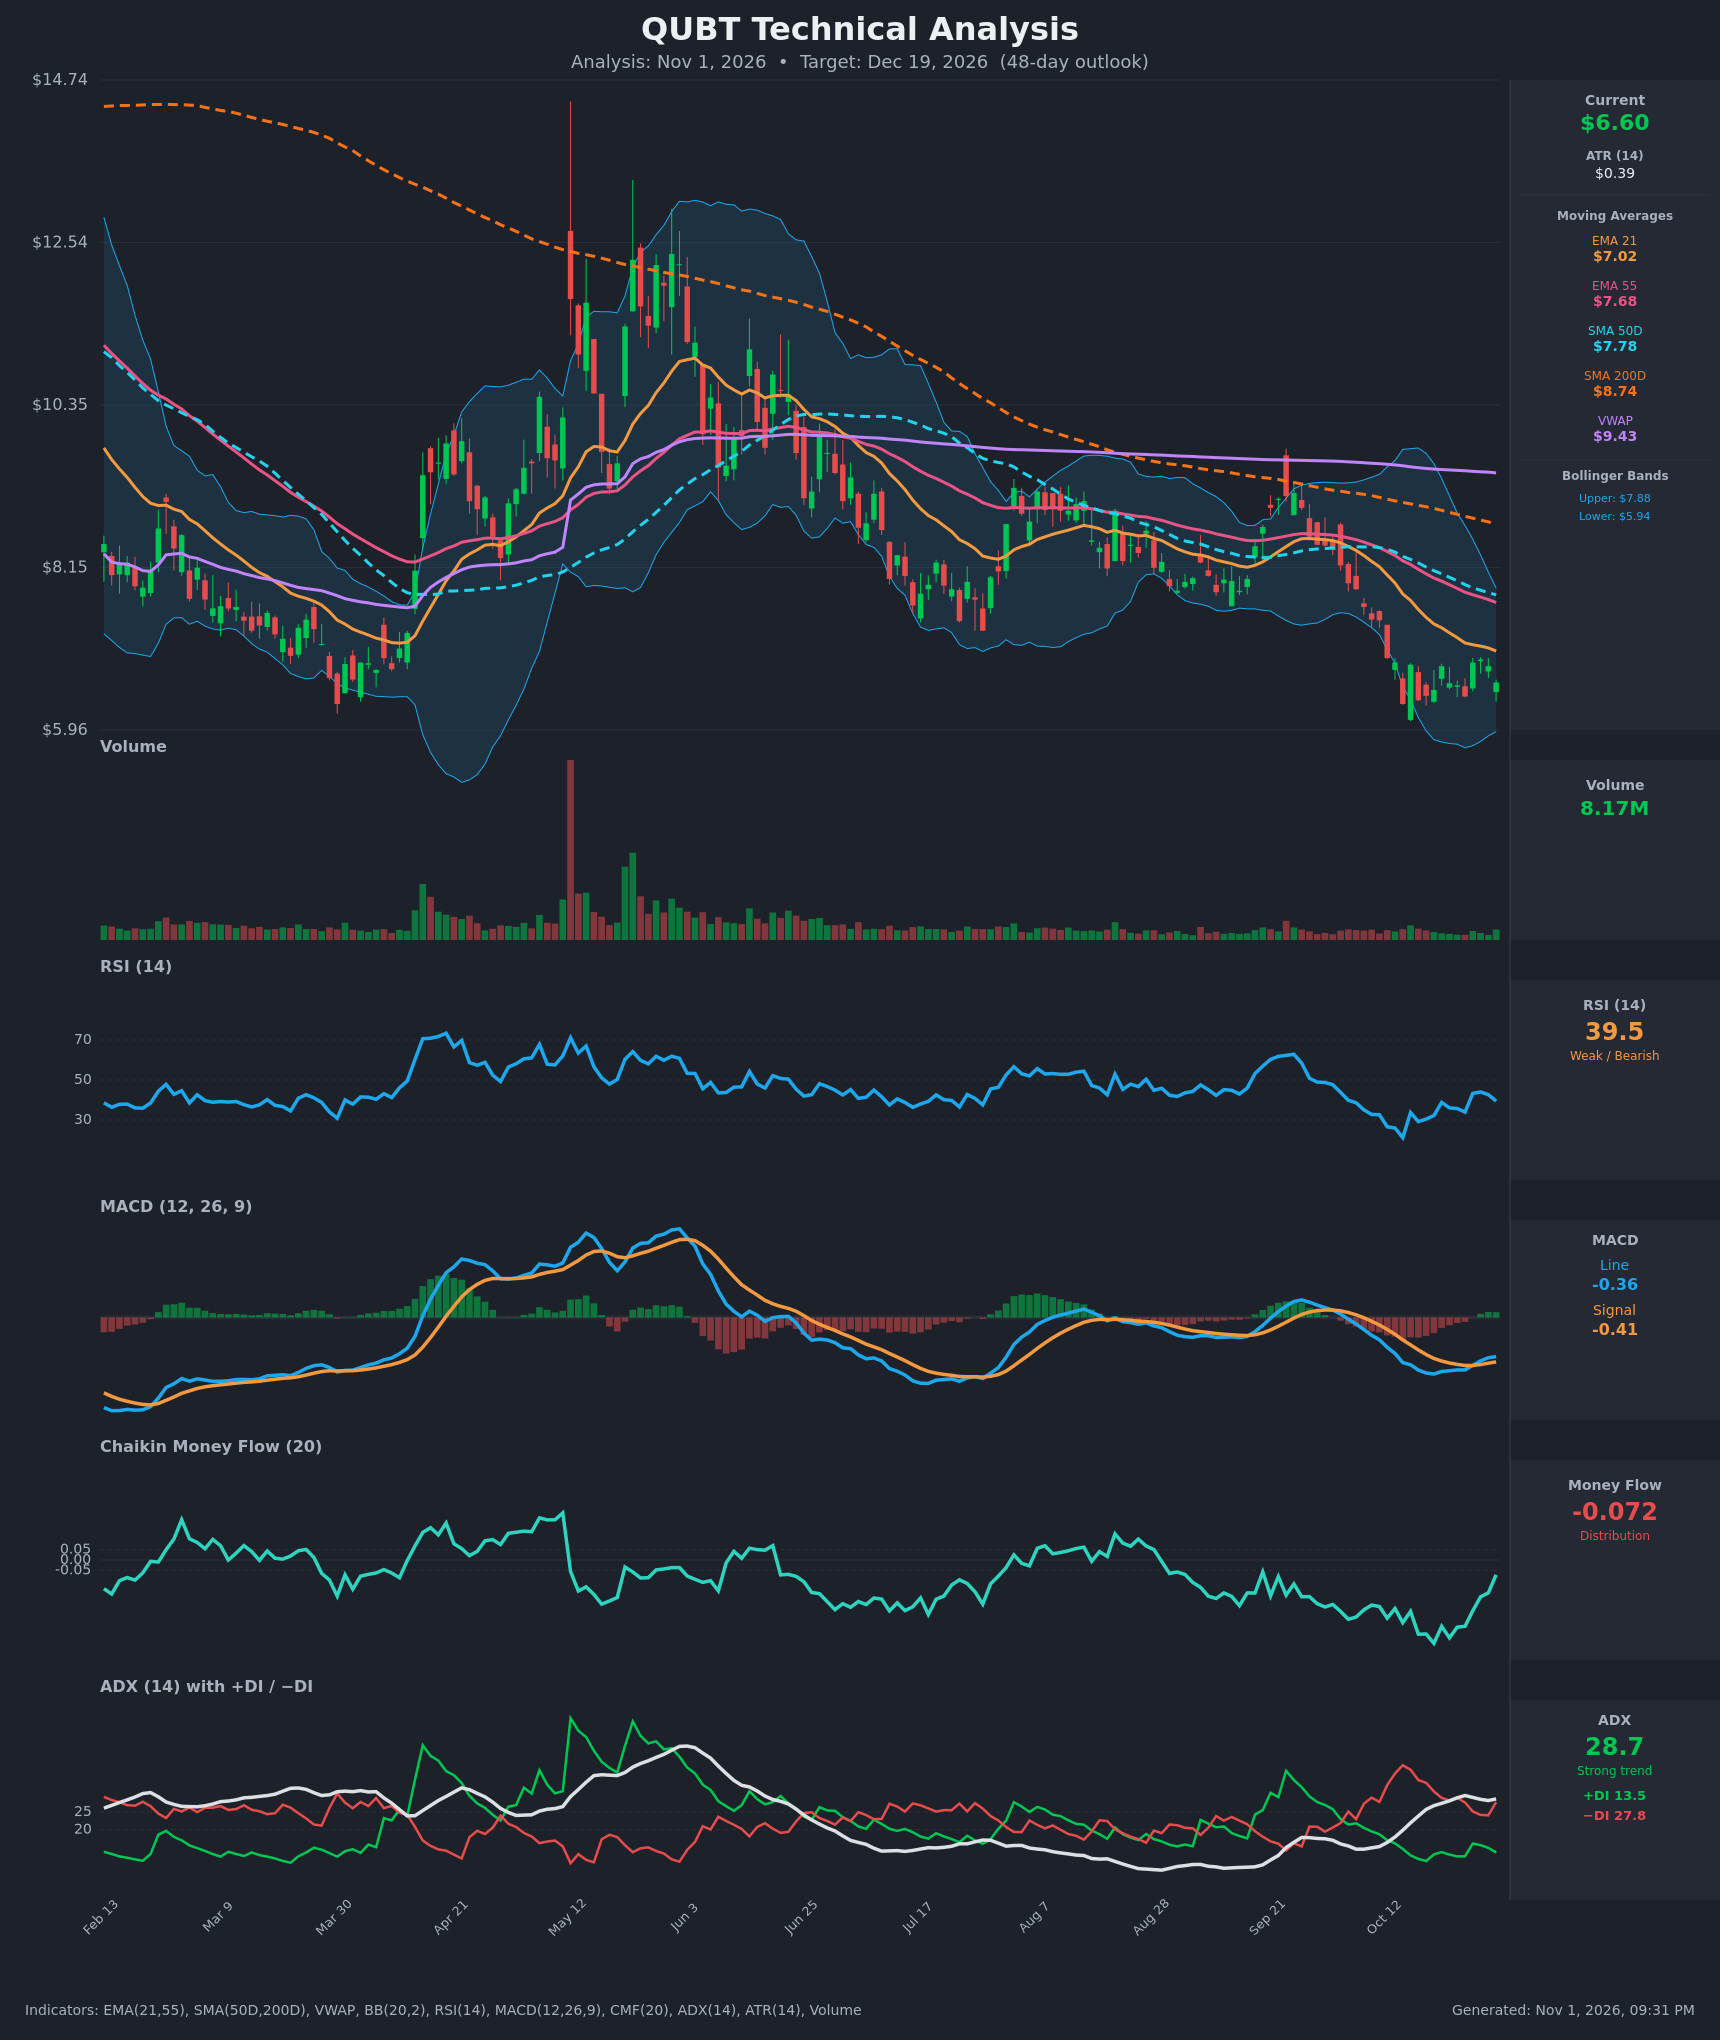
- RSI (14): 39.48, below the 50 midline but off the Oct 14 low of 21.1 (deeply oversold). It has recovered to the low 40s and is now rolling over again (44.0 → 39.5). Momentum is weak with no bullish regime shift. [Bearish]
- 20 EMA (EMA 21): $7.02, and price at $6.60 sits about 6% below it. The EMA is sloping down and has acted as resistance throughout the October decline. EMA21 is also below EMA55 ($7.68), so the stack is bearish. [Bearish]
- MACD: Line -0.364 vs signal -0.413, so the line is just above the signal. The histogram is slightly positive and rising since Oct 26, a minor bullish crossover on Oct 27. Both lines remain below zero, so this looks like a bounce within a downtrend rather than a trend change. [Neutral]
- Bollinger Bands (20): Upper $7.88, lower $5.94, with price at $6.60 in the lower third of the bands (about 34% of the band width). The bands are contracting after the Oct 14 touch of the lower band. The midline (~$6.9–7.0) is overhead resistance. [Bearish]
- CMF (20): -0.072, below the -0.05 threshold. It has improved from -0.40 in mid-October, but it is still in distribution territory and has been negative since early September. [Distribution]
- ADX (14): 28.7 with +DI 13.5 and -DI 27.8. This is a strong trend with the bears clearly on top, and the -DI/+DI gap is roughly 2:1. ADX is flat to slightly lower from its 29.7 peak, so the trend is mature but intact. [Strong Trend – Bearish]
- Volume: 8.17M, light relative to the spikes in April–June. The bounce candles carry thin volume, which suggests no strong buyer conviction. Selling pressure has also eased, which is consistent with consolidation near the lows. [Neutral-to-Bearish]
DIVERGENCES & TRENDS
- Bullish divergence (minor): Price made lower lows on Oct 14 and Oct 26 ($6.31 and $6.41), while RSI's second low (33.9) was well above the first (21.1). MACD momentum also improved.
- MA structure: Price is below EMA21, EMA55, SMA50D ($7.78), SMA200D ($8.74) and VWAP ($9.43). The SMA50D remains below the SMA200D (death cross in place), so this is a full bearish alignment.
- MA slopes: All moving averages are declining. The EMA21–SMA50D gap is narrowing, but there is no sign of an upside reclaim.
- MACD/CMF: MACD bullish crossover on Oct 27, but it is weak and sub-zero. CMF is rebounding toward neutral, which is a mild improvement.
- DI behavior: -DI has fallen from 38 to 28 and +DI has risen slightly, so the bearish pressure is fading but not reversed.
CHART PATTERNS
- Primary pattern: A Bearish Flag / Descending channel after the sharp drop from ~$8.3 to $6.3 in October. The lower-high structure (Oct 21 $6.82, Oct 27–28 $6.91) following the impulse leg is flag-like. A break below ~$6.30–6.40 projects a measured move of about $1.80–2.00 from the flag top. That would imply the ~$4.50–5.00 area.
- Alternative reading: A potential Bullish Double Bottom / base at $6.31–6.41 with a neckline near $6.90. A close above $6.90–7.00 (the EMA21) would be the first sign of reversal. Targets would be ~$7.50–7.80 (EMA55/SMA50D).
- Over the longer term, the larger structure is a series of lower highs since the May peak (~$14), a bearish primary trend.
POTENTIAL SCENARIOS
- Scenario 1: Bearish Flag Breakdown — Price fails at EMA21 resistance (~$7.0) and breaks below the double-bottom support at $6.30–6.40, continuing the strong -DI trend. The ADX above 25 and distribution CMF support a continuation. Trigger: daily close below $6.30 on rising volume. Target: $5.60–5.90 (lower Bollinger Band area, then extension). Invalidation: close above $7.05. (50% probability)
- Scenario 2: Neutral Range Consolidation — Price chops between $6.30 support and $7.00 resistance as RSI and MACD stabilize. Trigger: failure to break either side for several weeks. Target: $6.40–6.90. Invalidation: close outside $6.20–7.10. (25% probability)
- Scenario 3: Bullish Double-Bottom Reversal — The RSI divergence and MACD crossover lead to a break of the $6.90 neckline and a move to the declining moving averages. Trigger: close above $7.05 with volume expansion. Target: $7.70–7.80 (EMA55/SMA50D). Invalidation: close below $6.30. (25% probability)
PRICE TARGETS
For a 48-day timeframe (range width should be ~12–18%, and ATR of $0.39 is consistent with a ~$2.5–3.0 standard excursion over that time):
- Target Price: $6.05 (for 48 days)
- Expected Range: $5.20 to $7.20 (width $2.00 ≈ 30% of the current price, wider than the 12–18% guide because of QUBT's high volatility; this is a deliberate deviation based on ATR)
- Key Levels: Support at $6.31, Resistance at $7.02
Self-check note: the 30% width is above the 12–18% guide for 30–60 days, but ATR of ~6% of price per day supports a wider range. I am keeping it as a volatility-adjusted figure.
OVERALL BIAS
OVERALL BIAS: BEARISH - Price is below every major moving average with ADX at 28.7 and -DI (27.8) at roughly twice +DI (13.5), CMF is in distribution, and the bounce is on thin volume. The minor RSI/MACD improvement is not enough to override the primary downtrend, so lower prices near $6.05 are favored.
This is educational analysis and not financial advice.