PFE 48-day bullish forecast — Nov 1, 2026
- Bias: Bullish
- Timeframe: 48 days (made Nov 1, 2026, target date Dec 18, 2026)
- Price at analysis: $30.52
- Price target: $32.00
- Expected range: $28.90 – $33.50
- Result: Pending — graded after the close on Dec 18, 2026
Get a free AI analysis of PFE today
Analysis
TECHNICAL INDICATORS
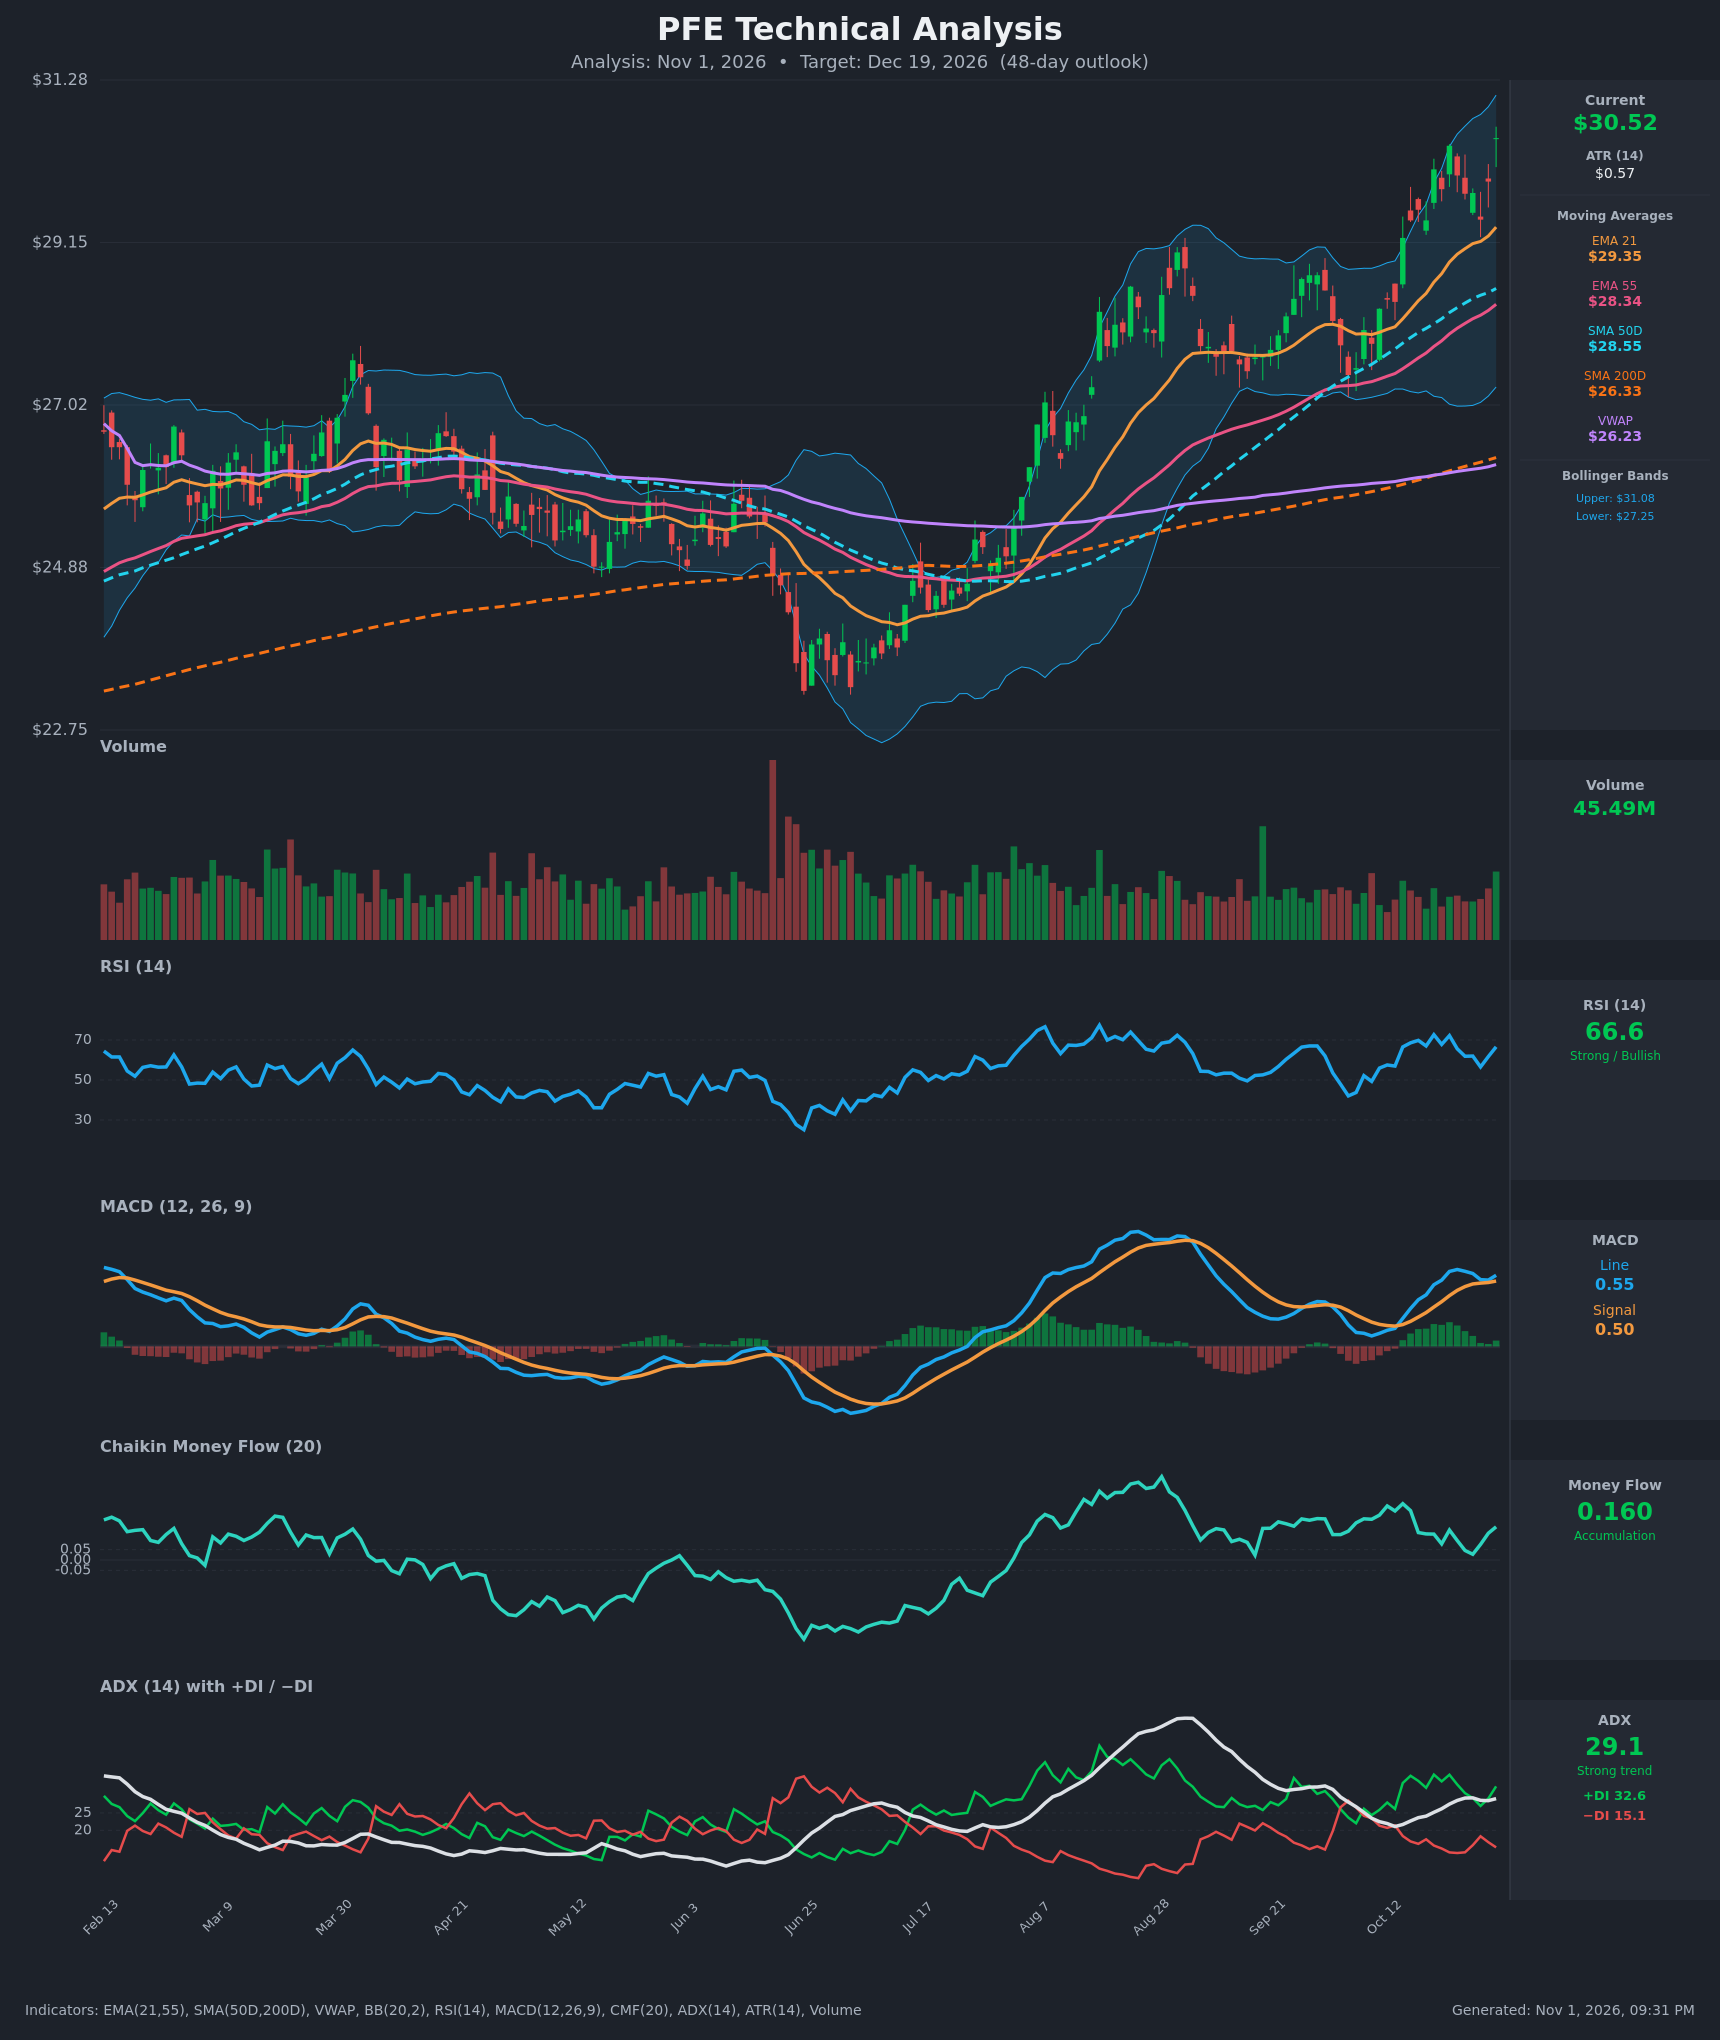
- RSI (14): 66.58, just under the 70 overbought line. It has oscillated between 56 and 73 over the last 15 bars and is turning up again after dipping to 56.5 on Oct 28. Momentum is strong but not yet stretched. The RSI highs (~72-73) are lower than the August peak (~77), a mild warning. [Bullish]
- 20 EMA (EMA 21 = $29.35): Price at $30.52 is about 4% above the rising EMA 21. EMA 21 is also above EMA 55 ($28.34), SMA50D ($28.55) and SMA200D ($26.33), a fully stacked bullish structure. The pullback on Oct 28 held just above the EMA 21 (about $29.16). [Bullish]
- MACD: Line 0.549 is above signal 0.504, with a small positive histogram (+0.045). Both lines are above zero. The histogram nearly collapsed on Oct 28-29 but the line never crossed below the signal, and it is now re-expanding. The MACD peak (~0.59) is far below the August peak (~1.2), so momentum is weaker than the price level implies. [Bullish]
- Bollinger Bands (20): Upper $31.08, lower $27.25, so price at $30.52 sits in the upper quarter of the bands (about 0.83 of the band width). The bands are widening, which signals volatility expansion in an uptrend. Price is only about $0.56 (one ATR) from the upper band, so a short-term stall or "band walk" is likely. [Bullish]
- CMF (20): 0.160, firmly above +0.05, and positive for the whole 15-bar window (low of 0.028 on Oct 27). Buyers are still accumulating on up days, though the reading is below the August peak. [Accumulation]
- ADX (14): 29.1, above 25 and rising from 21 in mid-October. +DI at 32.6 is well above −DI at 15.1, a wide bullish spread. This confirms a strong, established uptrend rather than a range. [Strong Trend – Bullish]
- Volume: 45.49M on the latest bar, a slight pickup after a quiet pullback, with green volume bars on the breakout days. No sign of heavy distribution. Volume has not surged on the move above $29, so the breakout is steady rather than explosive. [Mildly Bullish – supportive]
DIVERGENCES & TRENDS
- Mild bearish divergence: Price made a new high ($30.52) above the August high (~$29.2), but RSI (~72 vs ~77), MACD (0.55 vs ~1.2) and CMF (0.16 vs ~0.35) all made lower highs. This suggests the rally is maturing and that a pause or pullback is plausible, though it is not a reversal signal on its own.
- Trend structure: There is a clean series of higher highs and higher lows from the June low (~$23). Price is above every moving average, and SMA50D is well above SMA200D. The golden cross is already in place and is not a fresh signal.
- Crossovers: EMA21 > EMA55 is intact and widening. There has been no MACD bearish cross, and +DI has stayed above −DI throughout the window. +DI dipped to 27.0 on Oct 28 versus −DI at 18.3, so the spread tightened briefly before widening again.
- VWAP: Price is far above VWAP ($26.23), which reflects a strong longer-term buyer advantage but also an extended price.
- ADX trend: ADX re-accelerated from ~21 to 29, so the trend is regaining strength after a consolidation.
CHART PATTERNS
- Bullish continuation breakout / flag-type pullback: Price consolidated between roughly $27.2 and $29.2 through September and early October, then broke above the August high (~$29.2). The Oct 23-28 pullback was shallow and held the EMA 21, resembling a Bullish Flag/Pennant within the larger advance. The measured move from the flag (pole from ~$28.4 to ~$30.4, about $2) projects toward $32-32.5 if the breakout from the pause extends.
- Larger base: The June-to-October structure (low ~$23, higher-low base at ~$24.5 and ~$27.2) resembles a broad Bullish Inverted Head & Shoulders/rounded base that has already been cleared. The prior resistance at ~$29.2 should now act as support.
- Caution: Price is pressing the upper Bollinger Band with lower RSI/MACD highs, so a sideways flag around $29.5-31 is possible before continuation.
POTENTIAL SCENARIOS
- Scenario 1: Bullish Trend Continuation — Strong ADX, positive CMF and stacked moving averages favor further upside after a brief digestion near the upper band. Trigger: a daily close above $31.10 (upper Bollinger Band / recent high) with volume above 45M. Target: $32.00-$33.00 (flag measured move and ATR extension). Invalidation: a daily close below $29.20 (EMA 21 and prior breakout level). (55% probability)
- Scenario 2: Neutral Consolidation Near Highs — Price stalls at the upper band as RSI/MACD divergence plays out, and ranges between the EMA 21 and the upper band for several weeks. Trigger: repeated rejection at $31.0-31.3 with RSI falling back to 50-55. Target: $29.50-$31.00 range. Invalidation: a close above $31.50 (bullish) or below $28.90 (bearish). (25% probability)
- Scenario 3: Bearish Pullback / Failed Breakout — Divergences resolve with a MACD bearish cross and a drop through the EMA 21, retracing toward the SMA50D/EMA 55. Trigger: a daily close below $29.20 and a MACD signal cross down. Target: $28.30-$28.55 (EMA 55 / SMA50D), with an extension to $27.25 (lower band). Invalidation: a reclaim of $30.50 on rising volume. (20% probability)
PRICE TARGETS
Timeframe: 48 days (target date Dec 19, 2026). The range width must be about 12-18% of the current price.
- Target Price: $32.00
- Expected Range: $28.90 to $33.50 (width $4.60 ≈ 15.1% of the current price, consistent with the 30-60 day guidance)
- Key Levels: Support at $29.35 (EMA 21; the $29.20 breakout level is just below), Resistance at $31.28 (recent high / upper band area)
OVERALL BIAS
OVERALL BIAS: BULLISH - A strong, rising ADX (29.1) with +DI far above −DI, price above all key moving averages, positive CMF (0.16) and a MACD still above its signal line support further upside toward ~$32 over 48 days. The risks are the proximity to the upper Bollinger Band and the lower RSI/MACD highs, which make a pullback toward the $29.35 EMA 21 possible along the way.
This is educational analysis and not financial advice.