SLV 48-day bearish forecast — Nov 1, 2026
- Bias: Bearish
- Timeframe: 48 days (made Nov 1, 2026, target date Dec 18, 2026)
- Price at analysis: $44.60
- Price target: $43.00
- Expected range: $38.00 – $50.00
- Result: Pending — graded after the close on Dec 18, 2026
Get a free AI analysis of SLV today
Analysis
TECHNICAL INDICATORS
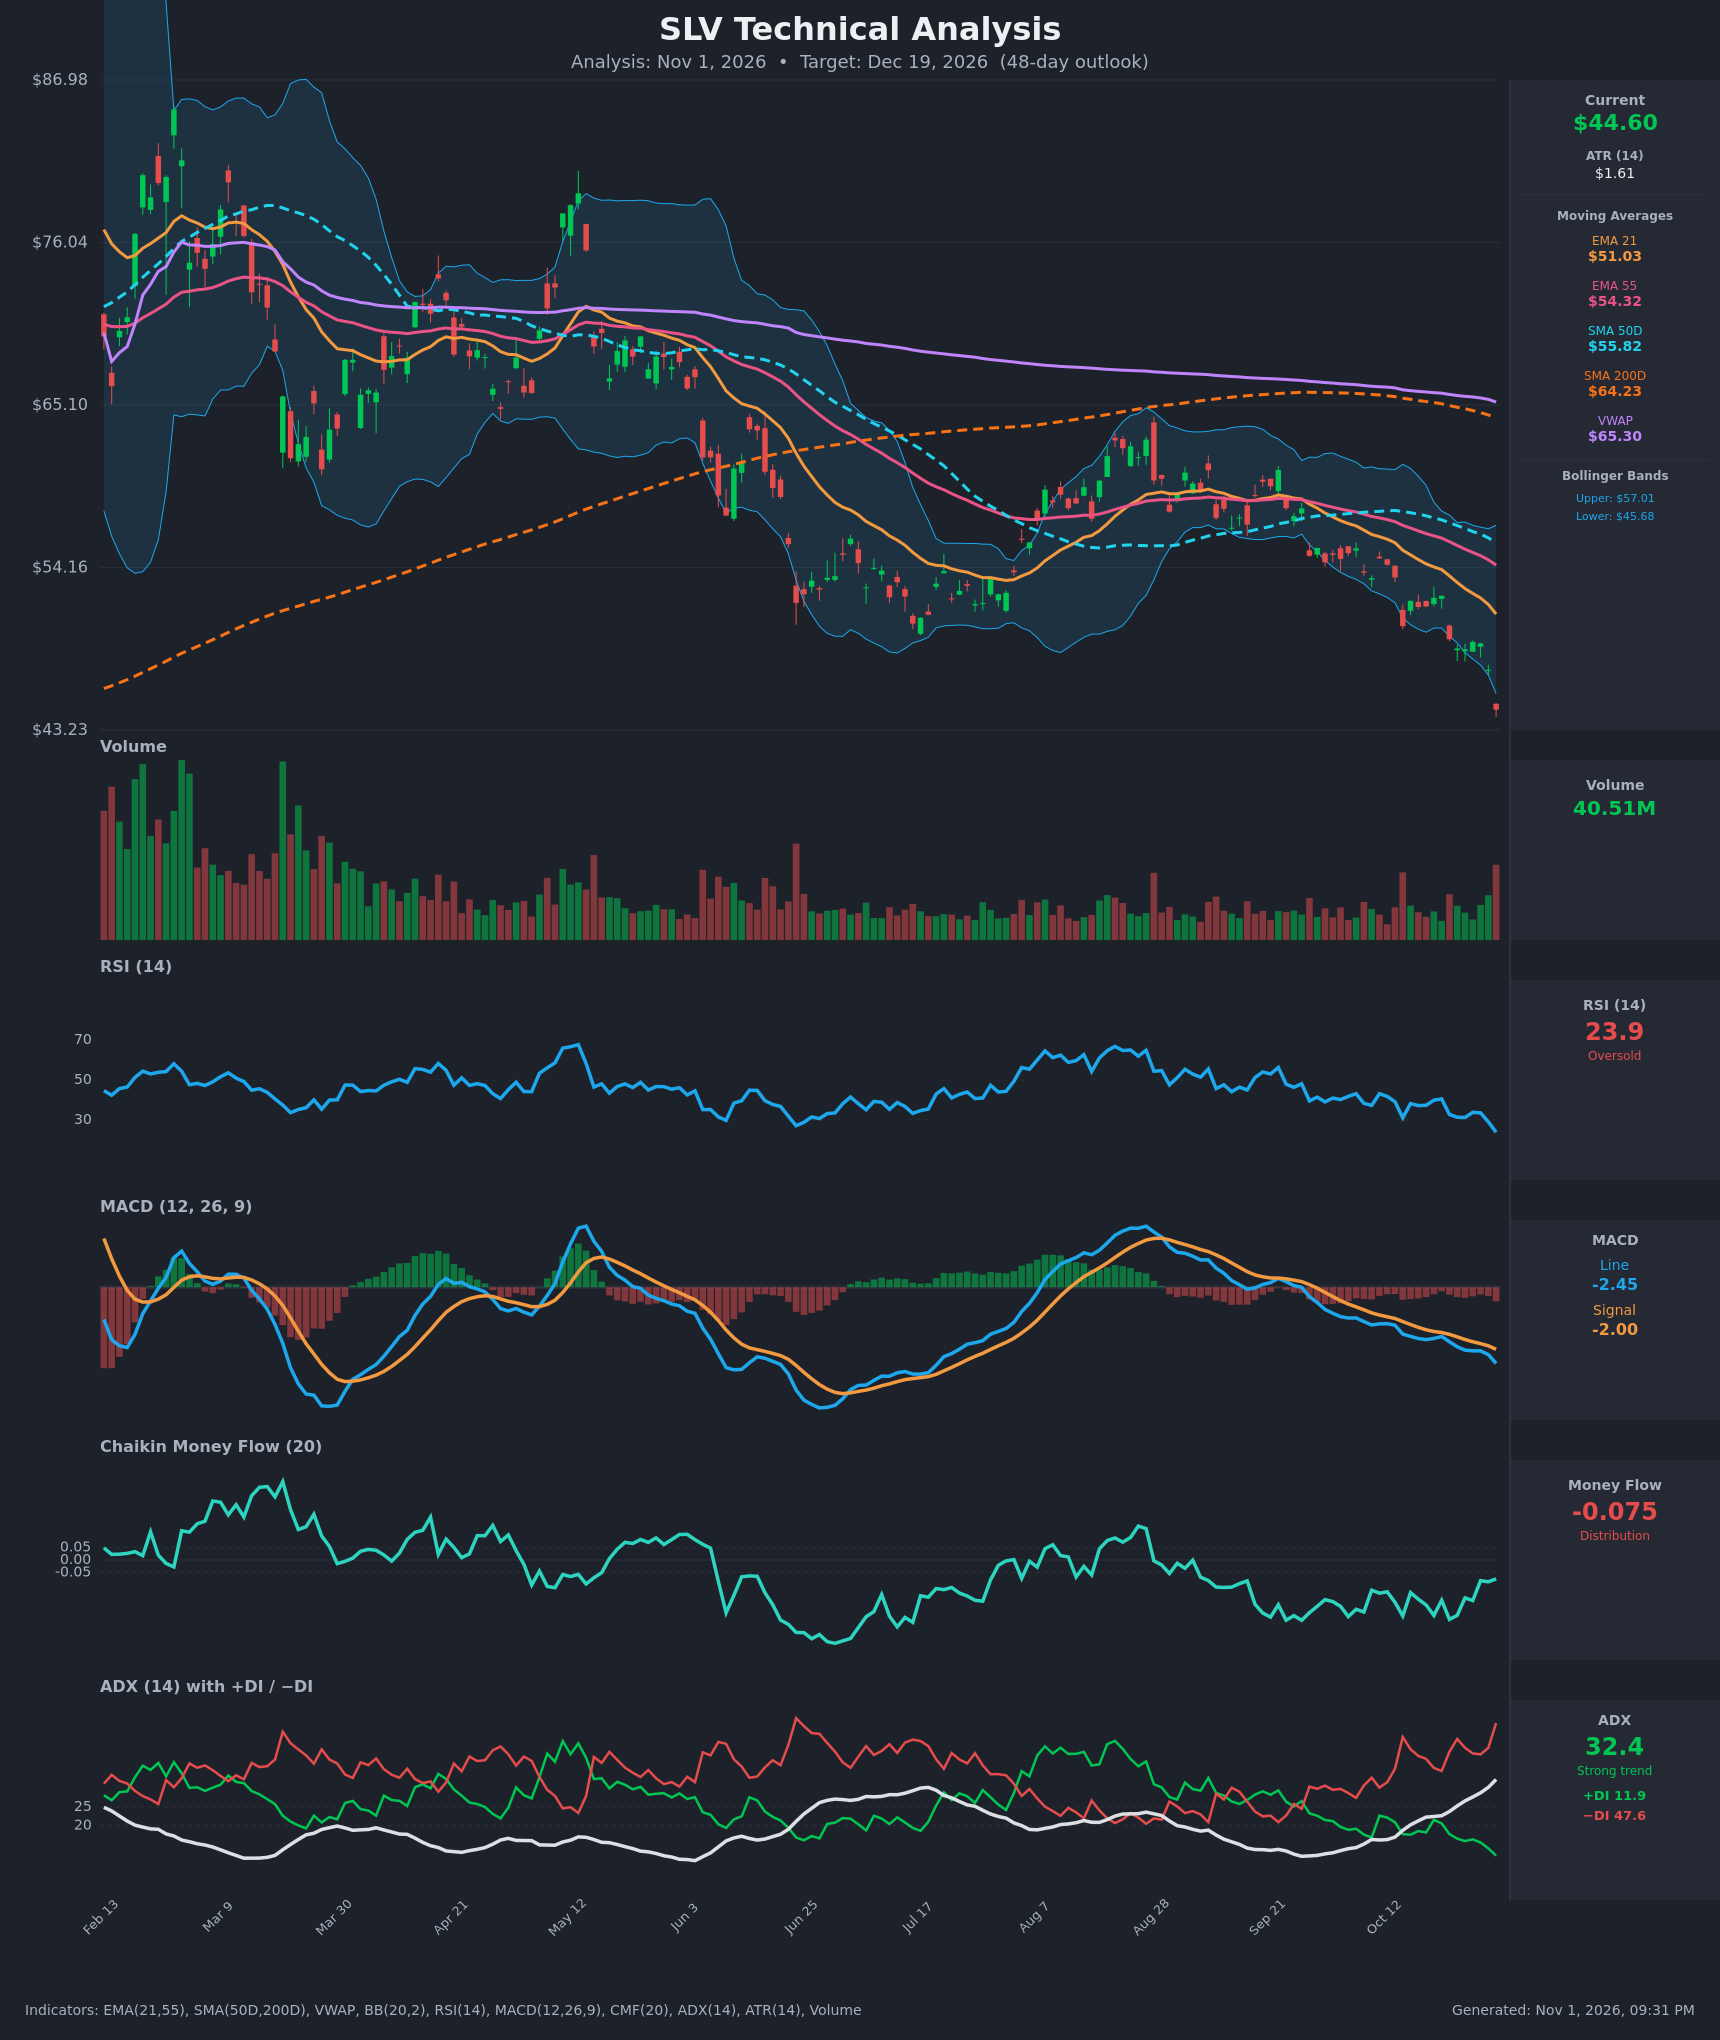
- RSI (14): 23.9, deeply oversold and falling hard from about 40 two weeks ago. Momentum is still pointing down, with no bullish divergence yet. The reading signals exhaustion risk but not a reversal. [Bearish]
- 20 EMA: The 21 EMA is $51.03 (the 20 EMA would be nearly identical). Price at $44.60 is about 12.6% below it, and the EMA is sloping down and acting as overhead resistance. EMA21 is also below EMA55 ($54.32), a bearish stack. [Bearish]
- MACD: Line -2.45 is below Signal -2.00, and the histogram is negative and widening (about -0.45). The line has been below the signal since early October and is accelerating down. [Bearish]
- Bollinger Bands (20): Upper is $57.01 and lower is $45.68. Price at $44.60 closed below the lower band, a band-walk breakdown. The bands are expanding downward. This is an extended move that often brings a snap-back toward the mid-band, but in strong trends it can keep walking. [Bearish]
- CMF (20): -0.075, below the -0.05 threshold. It has been persistently negative since June, with brief recoveries, which shows ongoing distribution. The reading is only mildly negative, so selling pressure is not extreme. [Distribution]
- ADX (14): 32.4 and rising, a strong trend. -DI is 47.6 against +DI 11.9, a very wide gap, so bears are firmly in control. [Strong Trend – Bearish]
- Volume: 40.51M, the highest in months, on a large red breakdown candle. Heavy volume on a drop to new lows confirms the selling. It could also mark capitulation, but there is no reversal candle yet. [Bearish confirmation / possible capitulation]
DIVERGENCES & TRENDS
- No bullish RSI or MACD divergence. Both made new lows along with price, so the downtrend is confirmed rather than weakening.
- Moving averages are fully bearish. Price is below EMA21 ($51.03), EMA55 ($54.32), SMA50D ($55.82), SMA200D ($64.23) and VWAP ($65.30). The SMA50D is below the SMA200D, so a death cross is already in place, and all of these averages are sloping down.
- MACD is below its signal and below zero with a widening histogram. The −DI/+DI gap is the widest of the year, and ADX is rising from about 15 to 32, so trend strength is building.
- Price fell from about $54 to $44.60 in 13 sessions, about 18%. The last bar dropped about 5.7% (roughly 1.7 ATR), which is a capitulation-style move.
- Price is stretched 12-13% below EMA21 with RSI under 25. Relief bounces are likely along the way, but the trend structure is intact.
CHART PATTERNS
- Bearish trend continuation / breakdown: The chart shows a series of lower highs and lower lows since the late-August peak near $64. Price rolled over from the $58-59 consolidation (Sep) and broke the $50 area.
- Bearish Rising Wedge / Flag characteristics: The September–early-October bounce was weak and corrective, a bearish flag-like structure. Its measured move (the prior leg of about $10 from the pole) points to roughly $44-45, which price has now reached.
- Support is thin: The chart's earlier lows are near $43.23 (the bottom of the chart axis), with little prior structure below the $49-50 June-July base. The base at $49-50 has broken and now acts as resistance.
- Bullish reversal patterns (double bottom, falling wedge) are not yet visible. A reversal would need a higher low after a base forms.
POTENTIAL SCENARIOS
- Scenario 1: Bearish Trend Continuation — Price keeps walking the lower band with the −DI dominating, with intermittent bounces failing at the EMA21 and prior breakdown area. Trigger: close below $43.23 and failure to reclaim $46. Target: $40.50 (about 2.5 ATR-weeks of further decline), with extension toward $38. Invalidation: daily close above $49.50. (45% probability)
- Scenario 2: Bullish Oversold Bounce Then Range — The capitulation volume and RSI near 24 trigger a relief rally to the mid-band and EMA21 area, then price stalls below declining resistance. Trigger: a bullish reversal candle with RSI turning up over 30. Target: $48.50–$51.00. Invalidation: loss of $43.00. (30% probability)
- Scenario 3: Neutral Base Formation — Price stabilizes between roughly $42 and $48 as selling exhausts. Trigger: ADX rolling over from the 30s and shrinking volume. Target: $44-46. Invalidation: break of either boundary on volume. (25% probability)
PRICE TARGETS
For the 48-day horizon (to Dec 19, 2026), a mean-reversion bounce is plausible, but trend and momentum favor a lower-to-flat outcome with a wide distribution. The range width is $40.00 to $50.50 = $10.50, or 23.5% of the current price, which fits the 18-30% guidance for 61-180 days and is a bit above that for 30-60 days. The 48-day window sits between the two, so the width is reasonable given the elevated ATR and volatility.
- Target Price: $43.00 (for the 48-day horizon)
- Expected Range: $38.00 to $50.00 (width $12.00, about 26.9% of current price, scaled for 48 days at elevated volatility)
- Key Levels: Support at $43.23, Resistance at $48.50
OVERALL BIAS
OVERALL BIAS: BEARISH - Price is below every moving average with a death cross in place, MACD and −DI are strongly bearish, ADX is rising above 30, and the breakdown came on the heaviest volume in months. Oversold RSI raises the odds of a relief bounce, but rallies are likely to meet resistance near $48.50–$51.
This is educational analysis and not financial advice.