ARM 62-day bearish forecast — Nov 1, 2026
- Bias: Bearish
- Timeframe: 62 days (made Nov 1, 2026, target date Jan 1, 2027)
- Price at analysis: $205.97
- Price target: $186.00
- Expected range: $158.00 – $216.00
- Result: Pending — graded after the close on Jan 1, 2027
Get a free AI analysis of ARM today
Analysis
TECHNICAL INDICATORS
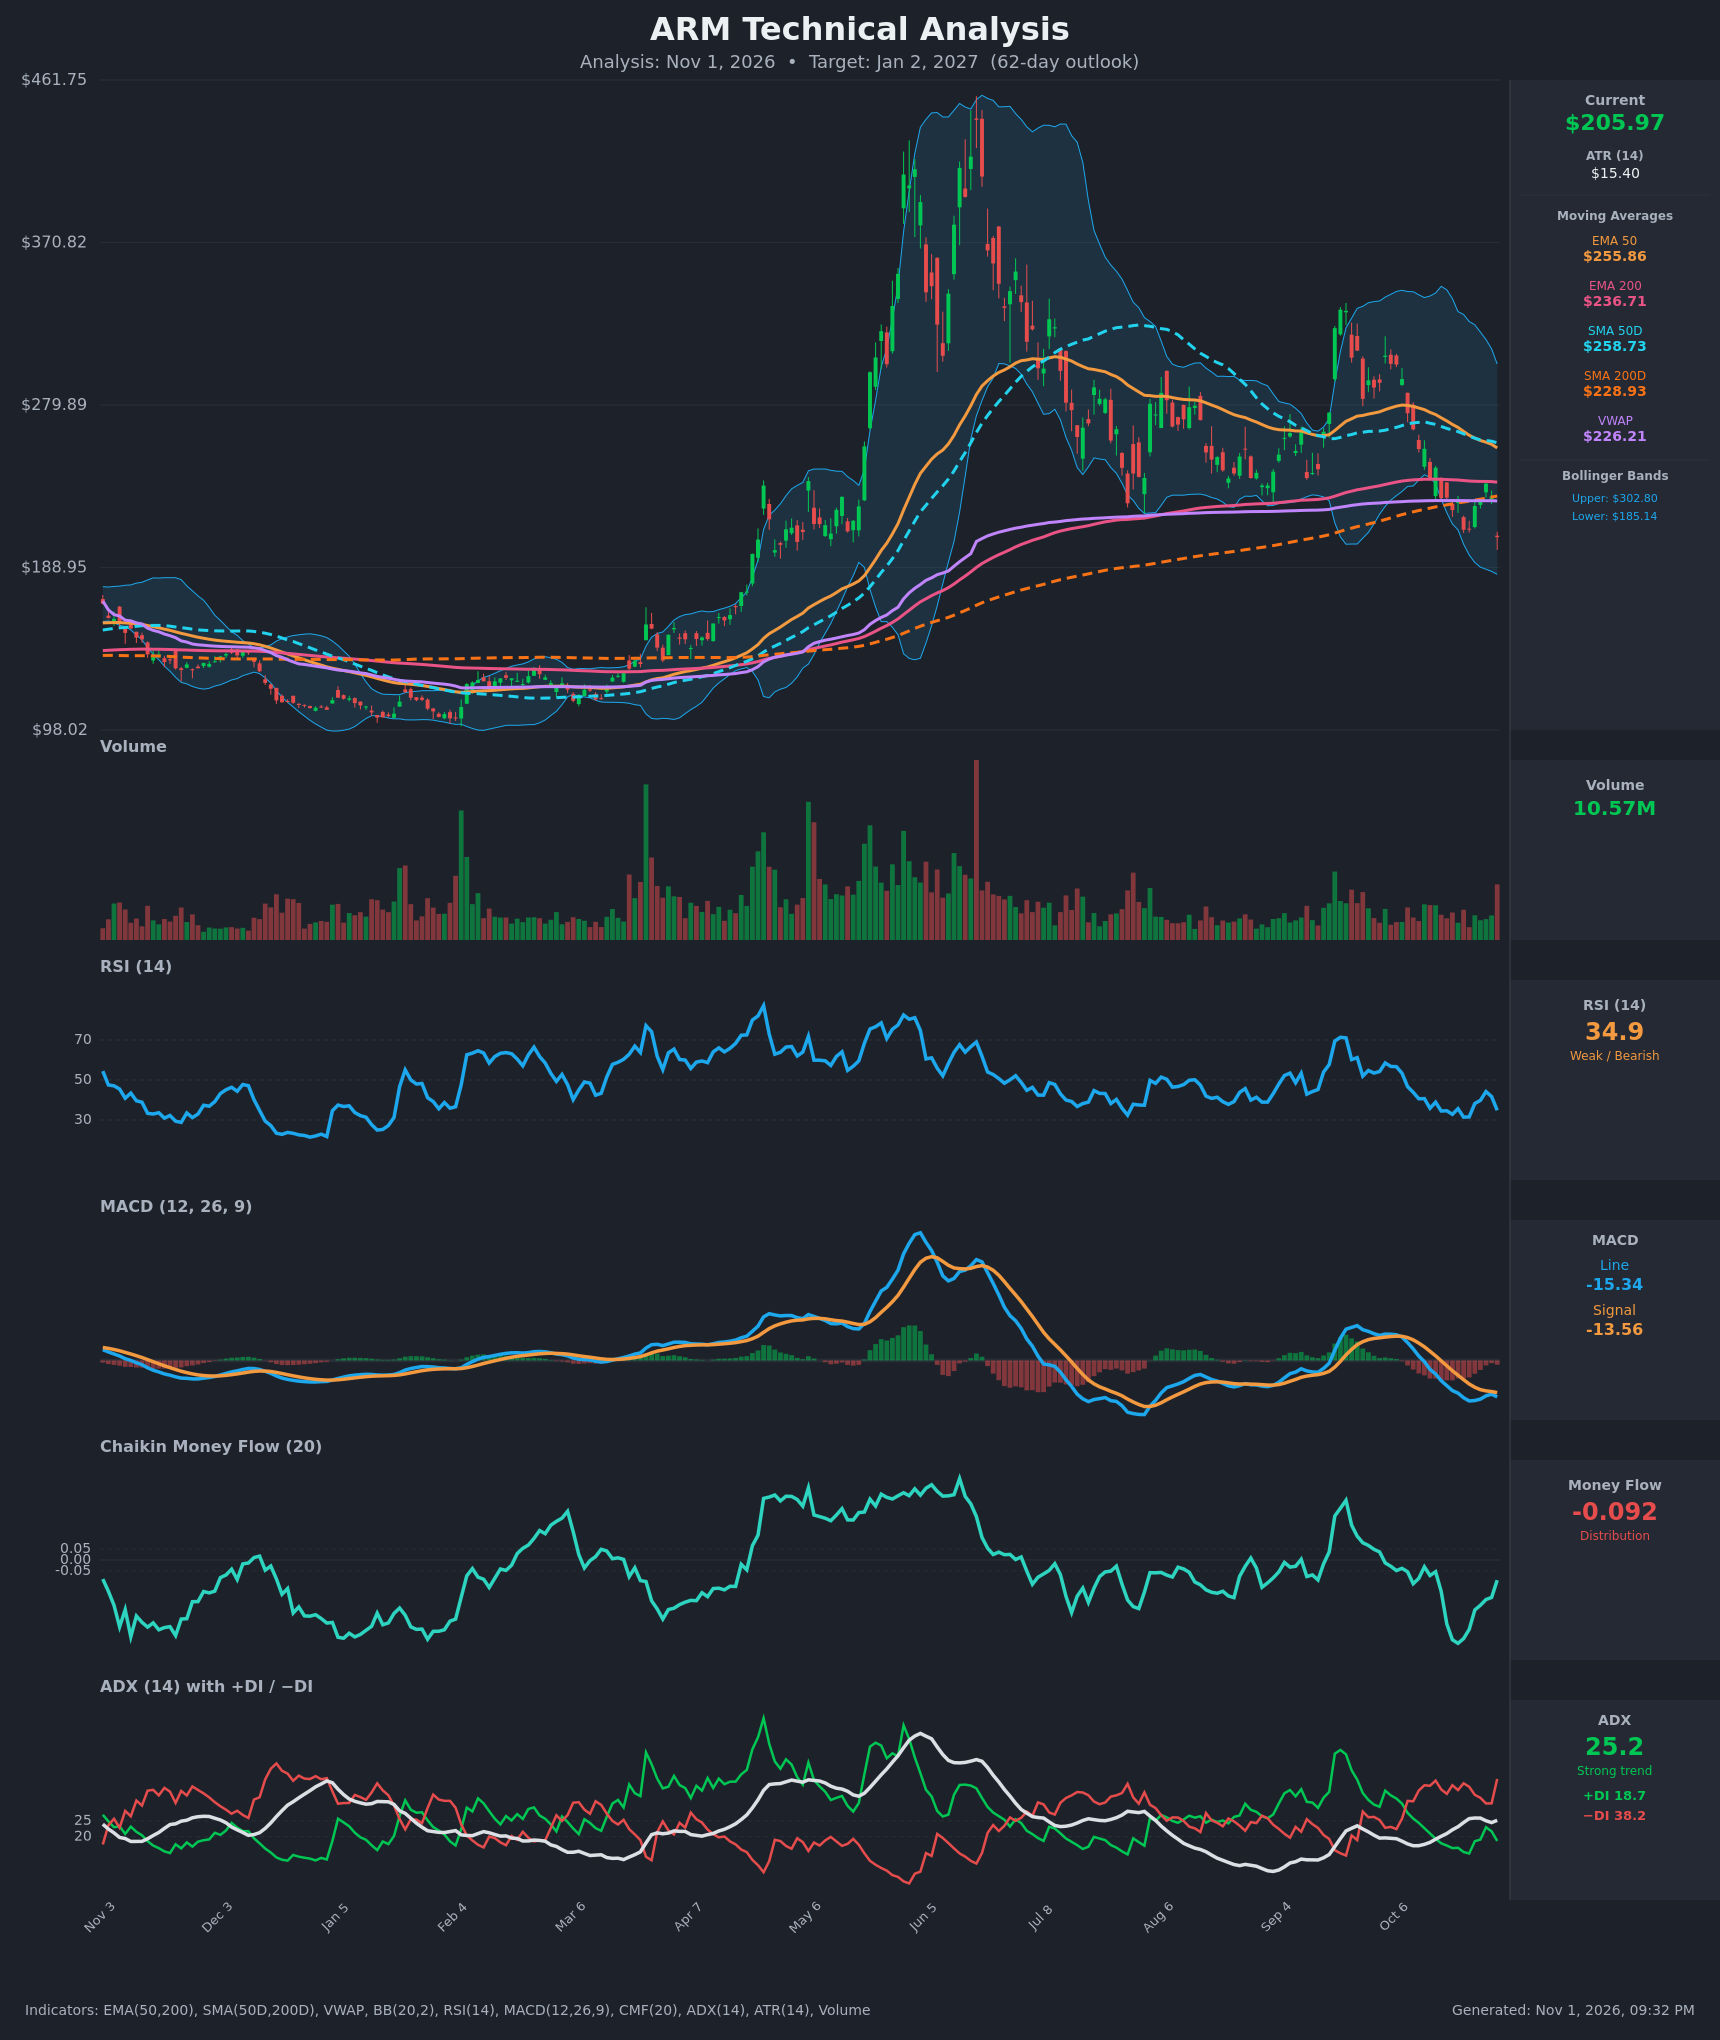
- RSI (14): 34.86, just above oversold. It slipped from 44.2 on Oct 28 to 34.9 in two sessions, so momentum is turning down again. Price made a marginally lower low ($205.97 vs $210.10) while RSI is higher than its 31.4 trough, a mild bullish divergence that is not yet confirmed. [Bearish]
- 20 EMA: Not supplied. Using the EMA 50 ($255.86) as the proxy, price sits about 19% below it and has been below it for weeks. The EMA 50 is falling and acts as heavy overhead resistance. [Bearish]
- MACD: Line -15.35 is below signal -13.56, a negative histogram of about -1.8. The line bottomed near -17.1 on Oct 23, then recovered and has now rolled over again (-14.2 to -15.3). A fresh bearish re-acceleration. [Bearish]
- Bollinger Bands (20): Upper $302.80, lower $185.14, midpoint about $244. Price is in the lower quarter of the bands, about 11% above the lower band. The bands are wide, so volatility is high. There is room to tag the lower band, but a walk down the band is possible in a trend. [Bearish]
- CMF (20): -0.092, below the -0.05 threshold, so mild distribution. It has recovered from -0.379 on Oct 21, which suggests selling pressure is easing, but it is still negative. [Distribution]
- ADX (14): 25.2 and rising from 17 in mid-October, with −DI 38.2 far above +DI 18.7. This is a strong, established downtrend with bears firmly in control. [Strong Trend – Bearish]
- Volume: 10.57M on the latest bar, among the highest of recent weeks, on a red candle with a roughly 10% drop. A heavy-volume breakdown through the $210-$225 area suggests real selling, not drift. [Bearish – Distribution]
DIVERGENCES & TRENDS
- Mild bullish divergence: Price made a lower low ($205.97 vs $210.10 on Oct 22-23), while RSI (34.9 vs 31.4) and the MACD line (-15.3 vs -17.1) did not. CMF is also well off its low. This points to a possible relief bounce, but it is weak without a price and volume confirmation.
- Moving average structure: Price is below the EMA 50, SMA 50, EMA 200, SMA 200 and VWAP ($226.21). Price has now lost the SMA 200 ($228.93), which is a long-term trend break.
- Death cross watch: SMA 50 ($258.73) is still above SMA 200 ($228.93), but the gap has narrowed steadily as SMA 50 falls. EMA 50 ($255.86) is converging on EMA 200 ($236.71). A death cross is plausible within the 62-day window if price stays depressed.
- MACD: Bearish crossover on Oct 16 (the line crossed below signal), and the line has stayed below signal since. The Oct 26-29 bounce failed to cross back above.
- DI: −DI has been above +DI throughout, and the gap widened sharply on the latest drop (38.2 vs 18.7). ADX is crossing back above 25.
- Peak-to-peak structure: Lower highs from ~$450 (June) to ~$340 (Sep), then to ~$255 (Oct), with lower lows following.
CHART PATTERNS
- Bearish Head and Shoulders (loose fit): The June ~$450 spike is the head, the May rally and the September ~$340 peak are the shoulders, and the neckline runs around $210-$225 (the July-October lows). Price is now breaking this neckline on heavy volume. The full measured move would be extreme, so I treat it as bearish confirmation, not a literal target.
- Lower highs and lower lows (a descending-channel, flag-like decline): This is a bearish continuation structure. The first measured target is the Bollinger lower band and the pre-breakout base at ~$185, with an extension to ~$160 (the late-April breakout gap region).
- Counter-risk: A Bullish Double Bottom could form if $205-$210 holds and RSI diverges higher. It needs a close above $226-$229 (VWAP/SMA 200) to confirm.
POTENTIAL SCENARIOS
- Scenario 1: Bearish Continuation Breakdown — The neckline break on heavy volume, −DI dominance and a falling MACD drive a continued decline toward the Bollinger lower band and the prior base. Trigger: daily close below $205 with volume staying elevated. Target: $185 first, then $160-$170. Invalidation: daily close above $229 (SMA 200). (55% probability)
- Scenario 2: Bullish Oversold Relief Rally — The RSI/MACD divergence and improving CMF lead to a mean-reversion bounce back to the VWAP/SMA 200 area, which then acts as resistance. Trigger: close above $226 on rising volume. Target: $228-$237 (SMA 200 / EMA 200). Invalidation: close below $195. (28% probability)
- Scenario 3: Neutral Range Chop — Price oscillates between ~$185 support and ~$226 resistance as selling exhausts, with no clean trend. Trigger: ADX falls below 20 and price holds $190-$225. Target: ~$205 midpoint. Invalidation: close outside $185-$229. (17% probability)
PRICE TARGETS
- Target Price: $186.00 (62-day target, Jan 2, 2027)
- Expected Range: $158.00 to $216.00 (width $58, about 28% of current price, consistent with the 61-180 day guidance)
- Key Levels: Support at $185.14, Resistance at $226.21
OVERALL BIAS
OVERALL BIAS: BEARISH - Price is below every major moving average and VWAP, −DI (38.2) is far above +DI (18.7) with ADX at 25 and rising, MACD is below signal and falling, CMF shows distribution, and the latest drop came on heavy volume. A relief bounce is possible given the mild RSI/MACD divergence, but the weight of evidence favors a drift toward the $185 Bollinger/base area.
This is educational analysis and not financial advice.