EEM 62-day bearish forecast — Nov 1, 2026
- Bias: Bearish
- Timeframe: 62 days (made Nov 1, 2026, target date Jan 1, 2027)
- Price at analysis: $61.04
- Price target: $58.00
- Expected range: $53.50 – $65.50
- Result: Pending — graded after the close on Jan 1, 2027
Get a free AI analysis of EEM today
Analysis
TECHNICAL INDICATORS
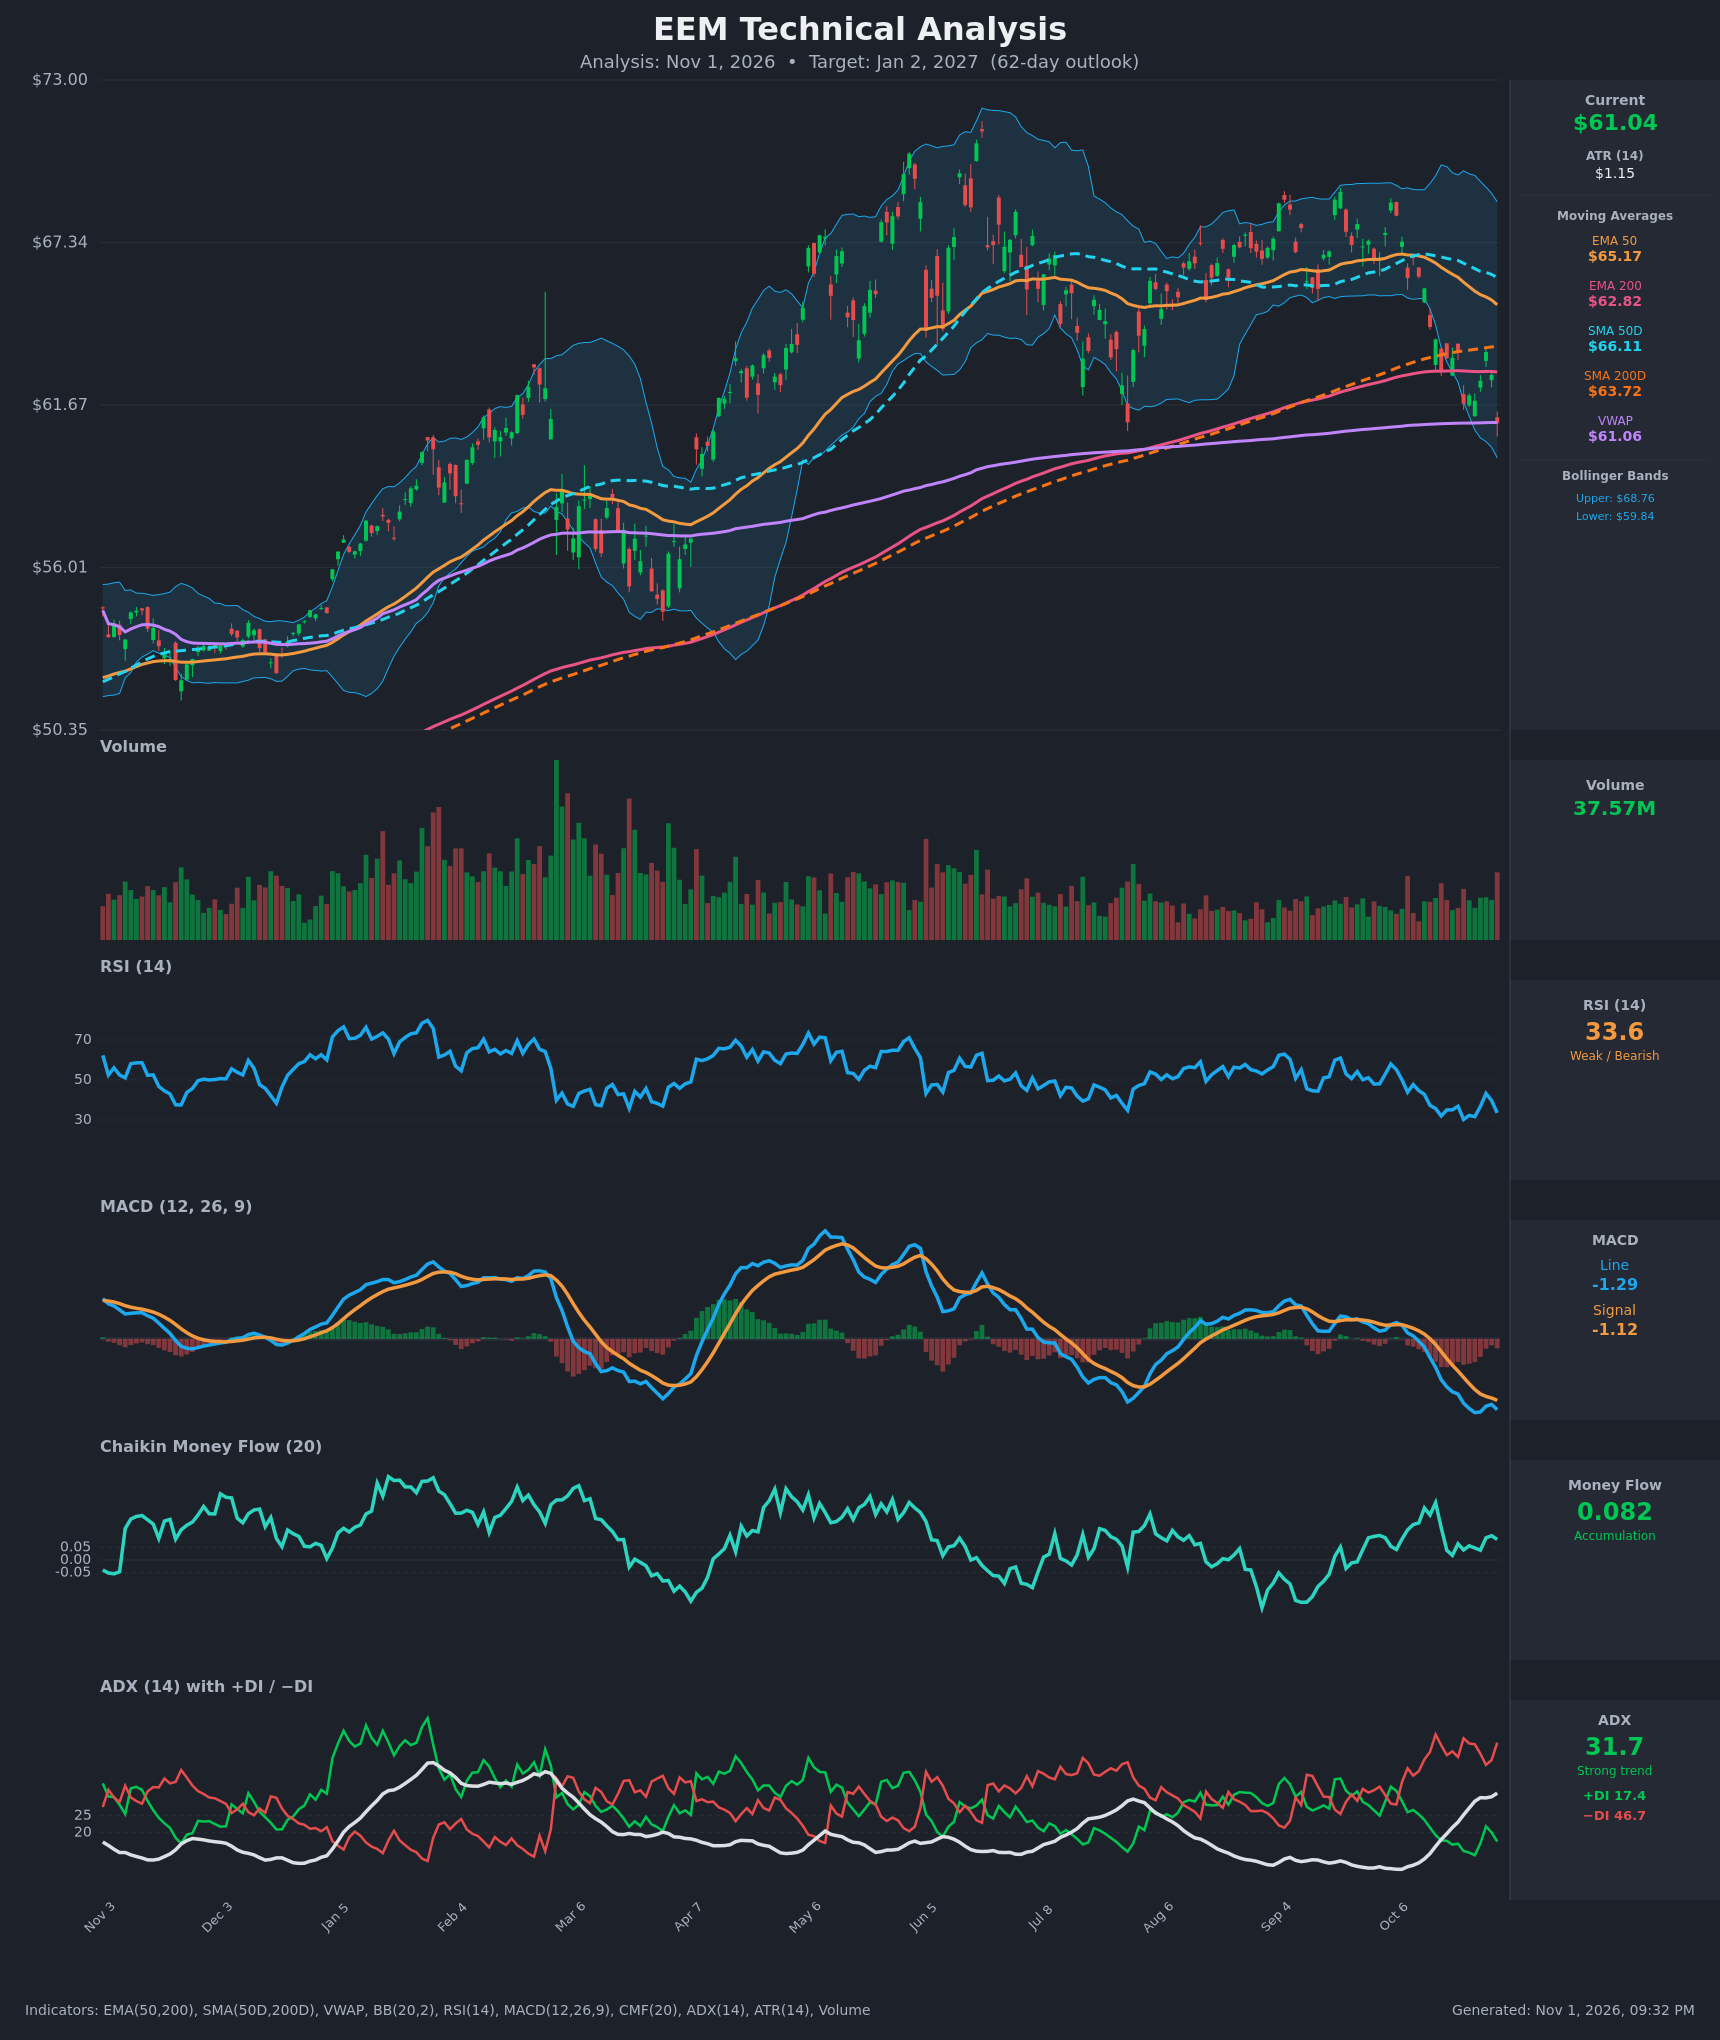
- RSI (14): 33.56, close to oversold (<30) after bouncing between 30 and 43 over the last two weeks. It has made lower highs and shows no bullish momentum shift yet. [Bearish]
- 20 EMA: The 20 EMA isn't supplied. Using the EMA 50 as the nearest proxy, it sits at $65.17 and is falling, with price about 6% below it. The EMA 200 at $62.82 has also been lost as support and is now overhead resistance. Price is below every moving average. [Bearish]
- MACD: The line is -1.286 and the signal is -1.116. It crossed below the signal on Oct 14-15 and is again below it after a brief attempt to recover on Oct 27-29. Both lines are deeply negative and the histogram is negative and widening again. [Bearish]
- Bollinger Bands (20): The bands run from $59.84 to $68.76, and price at $61.04 sits in the lower quarter. The bands expanded on the Oct drop. Price has been walking near the lower band, which is typical of a downtrend, though a short-term bounce toward the mid-band is possible. [Bearish]
- CMF (20): 0.082, above the +0.05 threshold and mildly positive. This is the main bullish divergence: there is no heavy distribution despite the price drop. It has faded from 0.20 to 0.08 over the last two weeks, however. [Accumulation]
- ADX (14): 31.7 and rising from 11 on Oct 12, so the trend is strong and strengthening. −DI at 46.7 is far above +DI at 17.4, so sellers are firmly in control. [Strong Trend – Bearish]
- Volume: 37.57M, with the latest bar showing a spike that closed red on the breakdown below $61.7. Selling days have carried heavier volume than the rebounds. [Mildly Bearish]
DIVERGENCES & TRENDS
- No bearish divergence: RSI and MACD are making new lows in line with price, which confirms the downtrend rather than warning of exhaustion.
- CMF divergence: CMF is still positive while price has dropped about 8% from Oct 12. This could mean dip buying, but it is fading and is not yet a reversal signal.
- Break of long-term support: Price lost the SMA 200 ($63.72) and the EMA 200 ($62.82) in mid-October. Both are now resistance, and the Oct 28 bounce to $63.52 failed right below them.
- DI dominance: −DI has led +DI since Oct 12, and the gap has widened to about 29 points.
- MA structure: EMA 50 ($65.17) is still above EMA 200 ($62.82), and SMA 50 ($66.11) is above SMA 200 ($63.72). There is no death cross yet, but both pairs are converging. A cross is plausible within the 62-day window if weakness persists.
- VWAP: Price at $61.04 is essentially on VWAP ($61.06), which is a pivotal level. It also coincides with the July swing low near $61.
CHART PATTERNS
- Bearish Head and Shoulders / Double Top (reversal): The May peak was near $72, followed by a lower high near $69-70 in Aug-Oct. The July low near $61 acts as a neckline. Price is now testing it.
- Confirmation: A decisive close below roughly $60-61 would confirm the pattern.
- Measured move: About $11 down from the neckline points to about $50, which is a stretch target. A more realistic first objective is $56-58.
- Failed range: Price was a $64-69 range from Aug to Oct and broke down on volume. The measured move of that range points toward the mid-to-high $50s.
- Caveat: The lower Bollinger Band at $59.84 is close, so a relief bounce toward $62.8-63.7 (the retest of the broken 200-day averages) would be a normal part of a bearish breakdown.
POTENTIAL SCENARIOS
- Scenario 1: Bearish Neckline Break and Trend Continuation — Price loses the $61 neckline and VWAP, and the lower band and RSI stay depressed as ADX holds above 30. A death-cross setup may begin to form. Trigger: daily close below $59.84 on above-average volume. Target: $56.00-$58.00, with an extension to about $54. Invalidation: daily close above $63.72 (SMA 200). (52% probability)
- Scenario 2: Bullish Oversold Bounce and Reclaim — Positive CMF and near-oversold RSI support a rebound back above the 200-day averages, with the broken range acting as a magnet. Trigger: close above $62.82 (EMA 200) and then $63.72, with MACD histogram turning up. Target: $65.00-$66.00 (EMA 50 / SMA 50 zone). Invalidation: close below $59.00. (30% probability)
- Scenario 3: Neutral Base Between $58 and $63 — Price chops around VWAP and the lower band while ADX cools. Trigger: failure to break either $59.84 or $62.82 for several weeks. Target: $60.00-$62.00. Invalidation: close outside $58-$63.50. (18% probability)
PRICE TARGETS
- Target Price: $58.00 (62-day, Jan 2, 2027)
- Expected Range: $53.50 to $65.50 (width $12.00, about 19.7% of the current price, consistent with the 18-30% guidance for 61-180 days)
- Key Levels: Support at $59.84, Resistance at $62.82
OVERALL BIAS
OVERALL BIAS: BEARISH - Price has broken below both 200-period averages and is testing the July low and VWAP. ADX is above 30 and rising, −DI dominates by a wide margin, and MACD is negative and widening. Positive CMF and near-oversold RSI make a relief bounce likely, but the weight of the evidence favors a lower price in 62 days.
This is educational analysis and not financial advice.