GLD 62-day bearish forecast — Nov 1, 2026
- Bias: Bearish
- Timeframe: 62 days (made Nov 1, 2026, target date Jan 1, 2027)
- Price at analysis: $355.78
- Price target: $345.00
- Expected range: $320.00 – $388.00
- Result: Pending — graded after the close on Jan 1, 2027
Get a free AI analysis of GLD today
Analysis
TECHNICAL INDICATORS
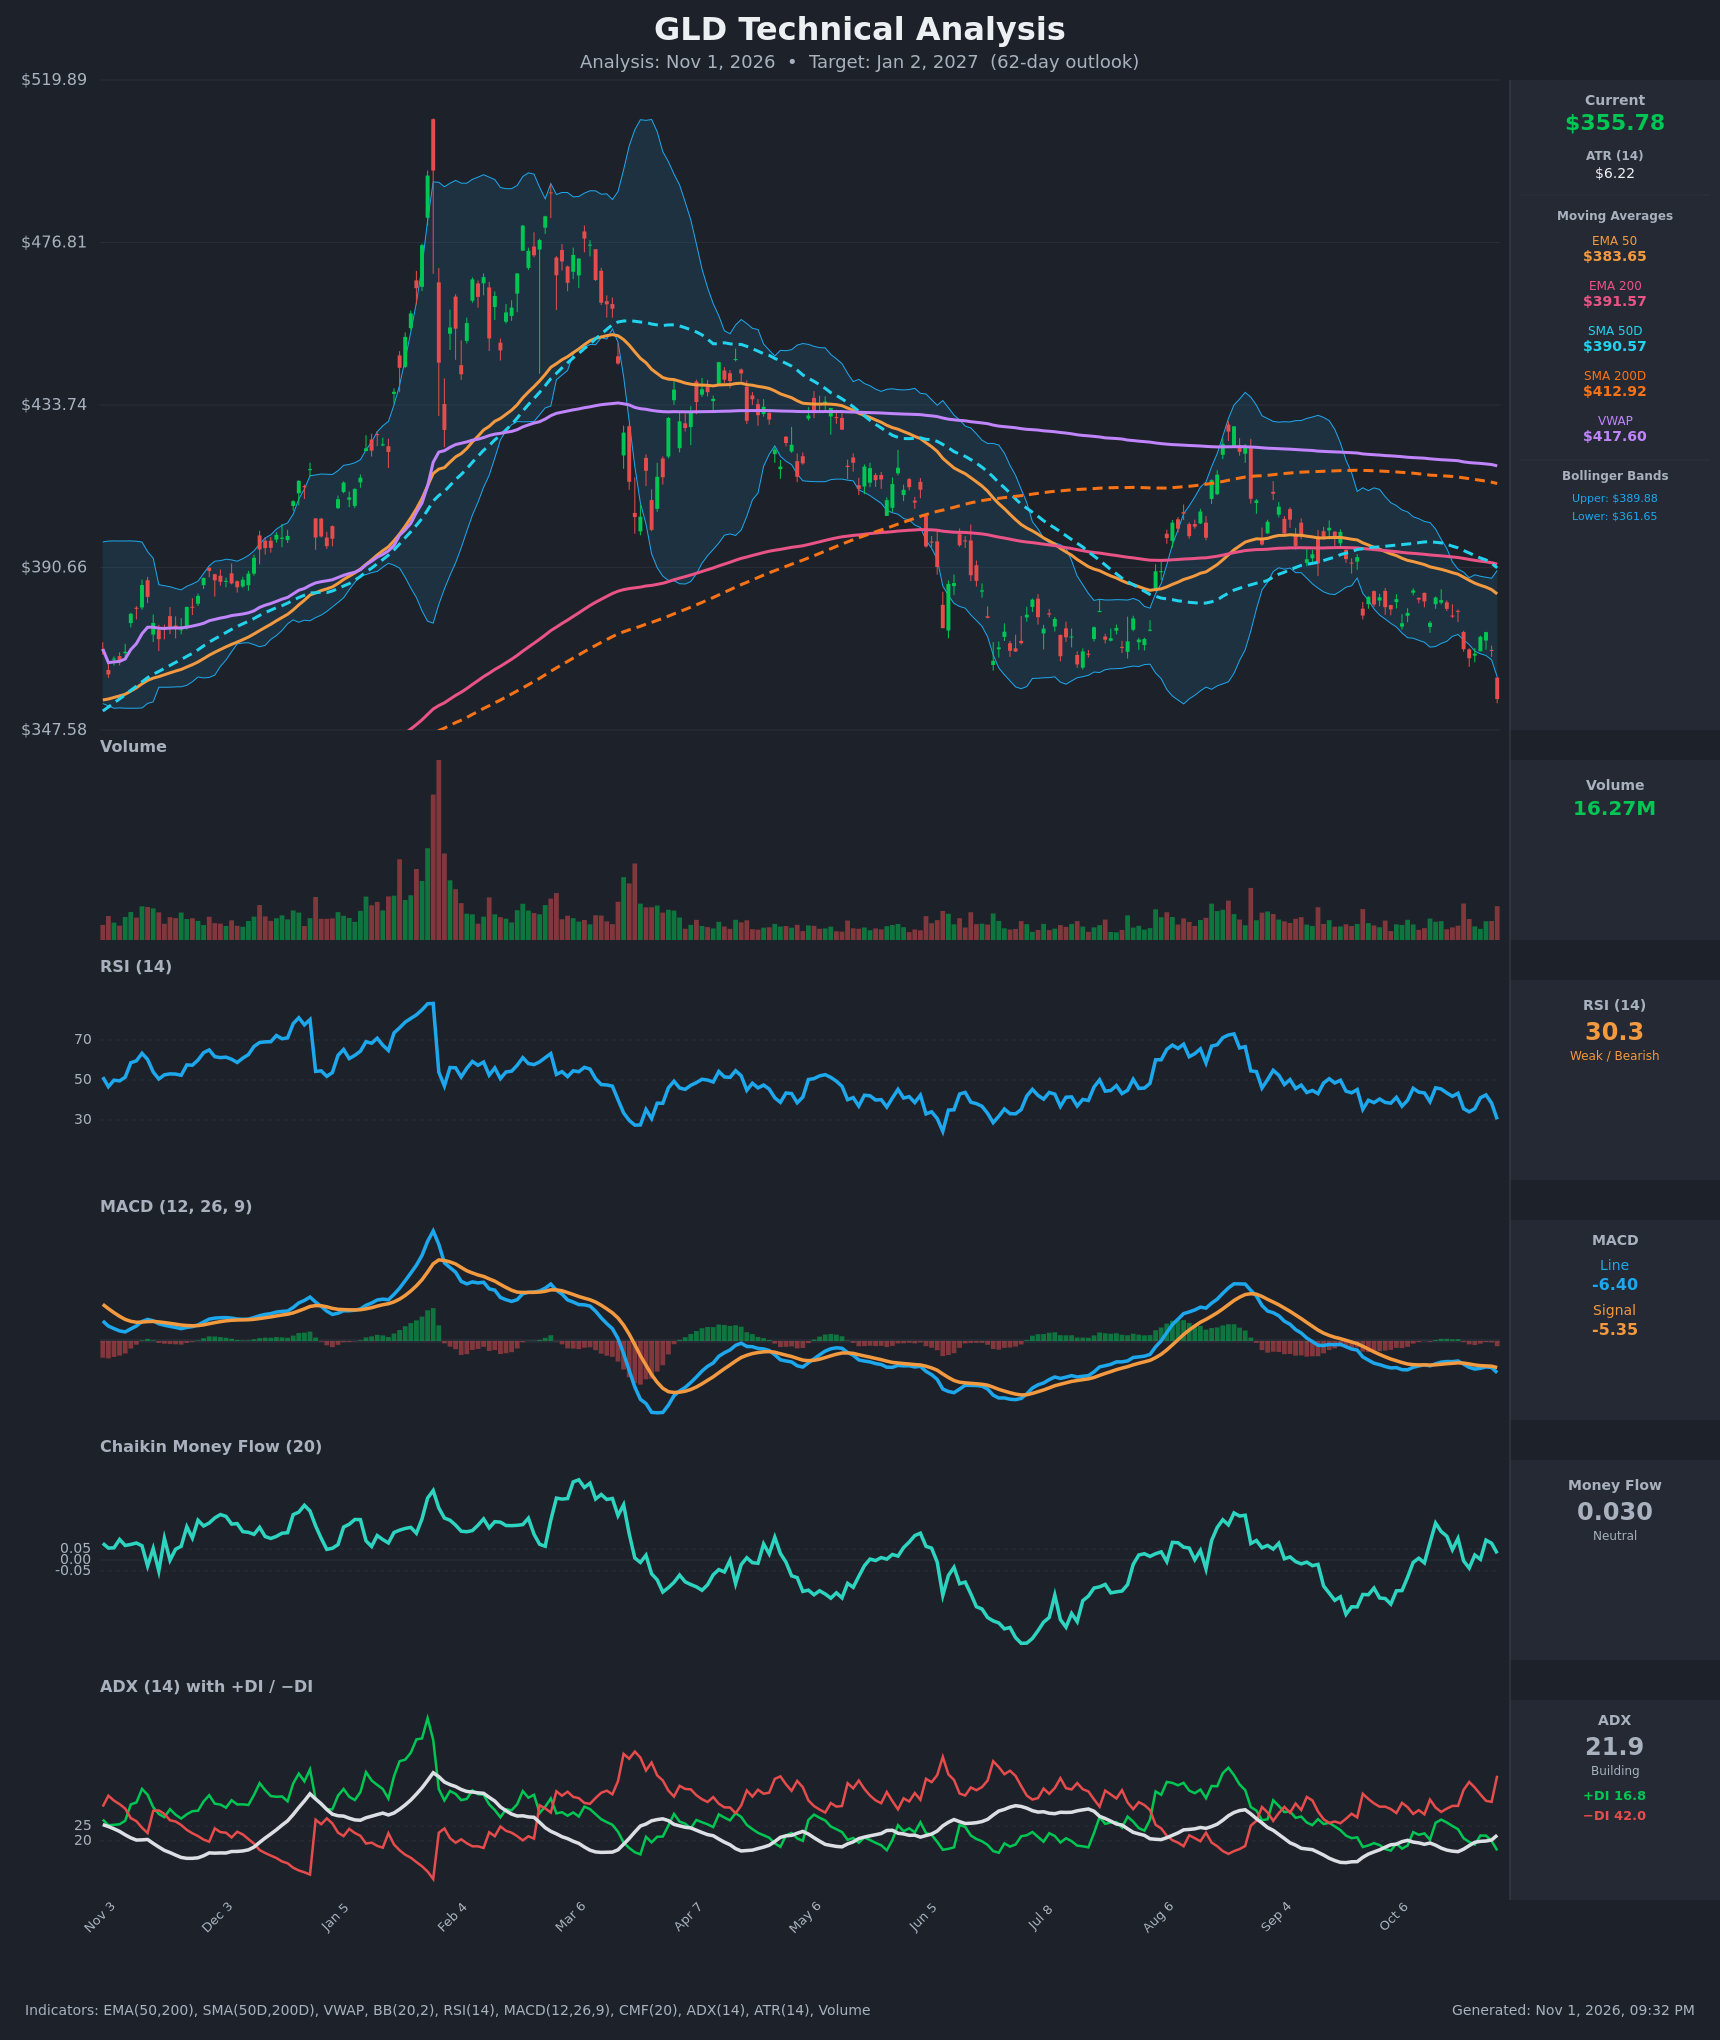
- RSI (14): 30.32, right at the oversold threshold and down sharply from 38.5 the day before and 42.6 on Oct 28. Momentum is falling hard, though a reading near 30 raises the odds of a technical bounce. [Bearish]
- 20 EMA: Not supplied. The Bollinger midline (the 20-period average) sits around $375.76, and price at $355.78 is about $20 below it. The 50 EMA ($383.65) and 200 EMA ($391.57) are also well overhead and act as resistance. [Bearish]
- MACD: Line -6.40 is below signal -5.35, a histogram of about -1.05. The gap widened on the latest bar after a brief convergence, so bearish momentum is re-accelerating. Both lines are below zero. [Bearish]
- Bollinger Bands (20): Price of $355.78 is below the lower band ($361.65), with the upper band at $389.88. The bands are narrowing slightly, and the close outside the lower band signals a strong downside push. This is an oversold stretch, but in a trend it often shows a "band walk" rather than an immediate reversal. [Bearish]
- CMF (20): 0.030, between the ±0.05 thresholds. There is no clear distribution yet, but it has faded from 0.09 on Oct 28 and money flow is not confirming a rebound. [Neutral]
- ADX (14): 21.9 and rising from 16.4 on Oct 21. That is just below the strong-trend threshold but turning up. −DI of 42.0 is far above +DI of 16.8, so bears control the trend. [Weak-to-Building Trend, Bearish]
- Volume: 16.27M, above the recent average, on the last large red candle that broke the Oct 23 low (~$366.6). Heavier volume on a breakdown bar supports the move. [Bearish confirmation]
DIVERGENCES & TRENDS
- Divergence: There is no bullish RSI divergence yet. RSI is making its low as price makes a new low, so momentum confirms the price decline. A bullish divergence would only form if price makes a lower low while RSI holds above ~30.
- Moving-average structure: Price is below the EMA50, EMA200, SMA50D, SMA200D and VWAP ($417.60), a fully bearish stack.
- Death cross: SMA50D ($390.57) is below SMA200D ($412.92), and the gap is widening. EMA50 crossed below EMA200 (383.65 vs 391.57) and the gap is widening. Both are long-term bearish trend signals.
- MACD: The line re-crossed further below signal, with a negative histogram.
- DI trend: −DI has surged from 29% to 42% while +DI collapsed to 16.8. That is a strong bearish shift in directional control.
- Price structure: Lower highs since the ~$440 peak in Aug/Sep, and a lower low versus the Oct 23 low ($366.61) and the Jun/Jul base (~$365-370). This confirms a downtrend and a breakdown of support.
CHART PATTERNS
- Descending triangle / bearish range breakdown: Price had bounced repeatedly in the ~$366-$372 zone, with lower highs capping rallies. The latest candle broke below that horizontal support. The measured move of the ~$20-$25 range height points to roughly $335-$345.
- Broad topping structure: The Jan-Feb peak near $519, followed by lower highs, resembles a large Head and Shoulders or distribution structure. The neckline near ~$390 broke earlier, which is consistent with a continued downtrend.
- Caveat: The break below the lower Bollinger Band with RSI at 30 means a relief bounce toward $366-$375 (broken support, now resistance) is plausible before any continuation.
POTENTIAL SCENARIOS
- Scenario 1: Bearish Breakdown Continuation — Price continues lower after losing the $366 support. −DI stays dominant and ADX pushes above 25, with the MACD histogram staying negative. A bounce, if any, is capped at the broken support of $366-$375. Trigger: daily close below ~$352 and failure to reclaim $366. Target: $340-$346, with an extension toward $330. Invalidation: daily close above ~$376 (Bollinger midline). (50% probability)
- Scenario 2: Bullish Oversold Mean-Reversion Bounce — RSI at 30 and a close outside the lower band prompt a rebound toward the 20-period mean. CMF is still non-negative, which may allow a squeeze higher. Trigger: reclaim of $366 on rising volume plus an RSI move back above 40. Target: $375-$384 (Bollinger midline to EMA50). Invalidation: close below $345. (33% probability)
- Scenario 3: Neutral Basing Range — Price stabilizes and chops between ~$345 and ~$372 as ADX stays near 20. Trigger: several closes holding $350-$370. Target: $355-$365. Invalidation: close outside $343-$375. (17% probability)
PRICE TARGETS
For the 62-day horizon (to about Jan 2, 2027), the expected range is $320.00 to $388.00. That is $68 wide, or 19.1% of the current price, in line with the 18-30% guidance for this timeframe.
- Target Price: $345.00 (62-day)
- Expected Range: $320.00 to $388.00
- Key Levels: Support at $340.00, Resistance at $366.00
OVERALL BIAS
OVERALL BIAS: BEARISH - Price has broken below prior support and the lower Bollinger Band. It sits below every moving average with a death cross in place, MACD is below signal and widening, and −DI (42) dominates +DI (16.8) with ADX turning up. The oversold RSI (30) makes a near-term bounce toward $366-$375 likely, but the weight of evidence favors a lower price over 62 days.
This is educational analysis and not financial advice.