MARA 62-day bearish forecast — Nov 1, 2026
- Bias: Bearish
- Timeframe: 62 days (made Nov 1, 2026, target date Jan 1, 2027)
- Price at analysis: $6.77
- Price target: $6.10
- Expected range: $4.90 – $7.90
- Result: Pending — graded after the close on Jan 1, 2027
Get a free AI analysis of MARA today
Analysis
TECHNICAL INDICATORS
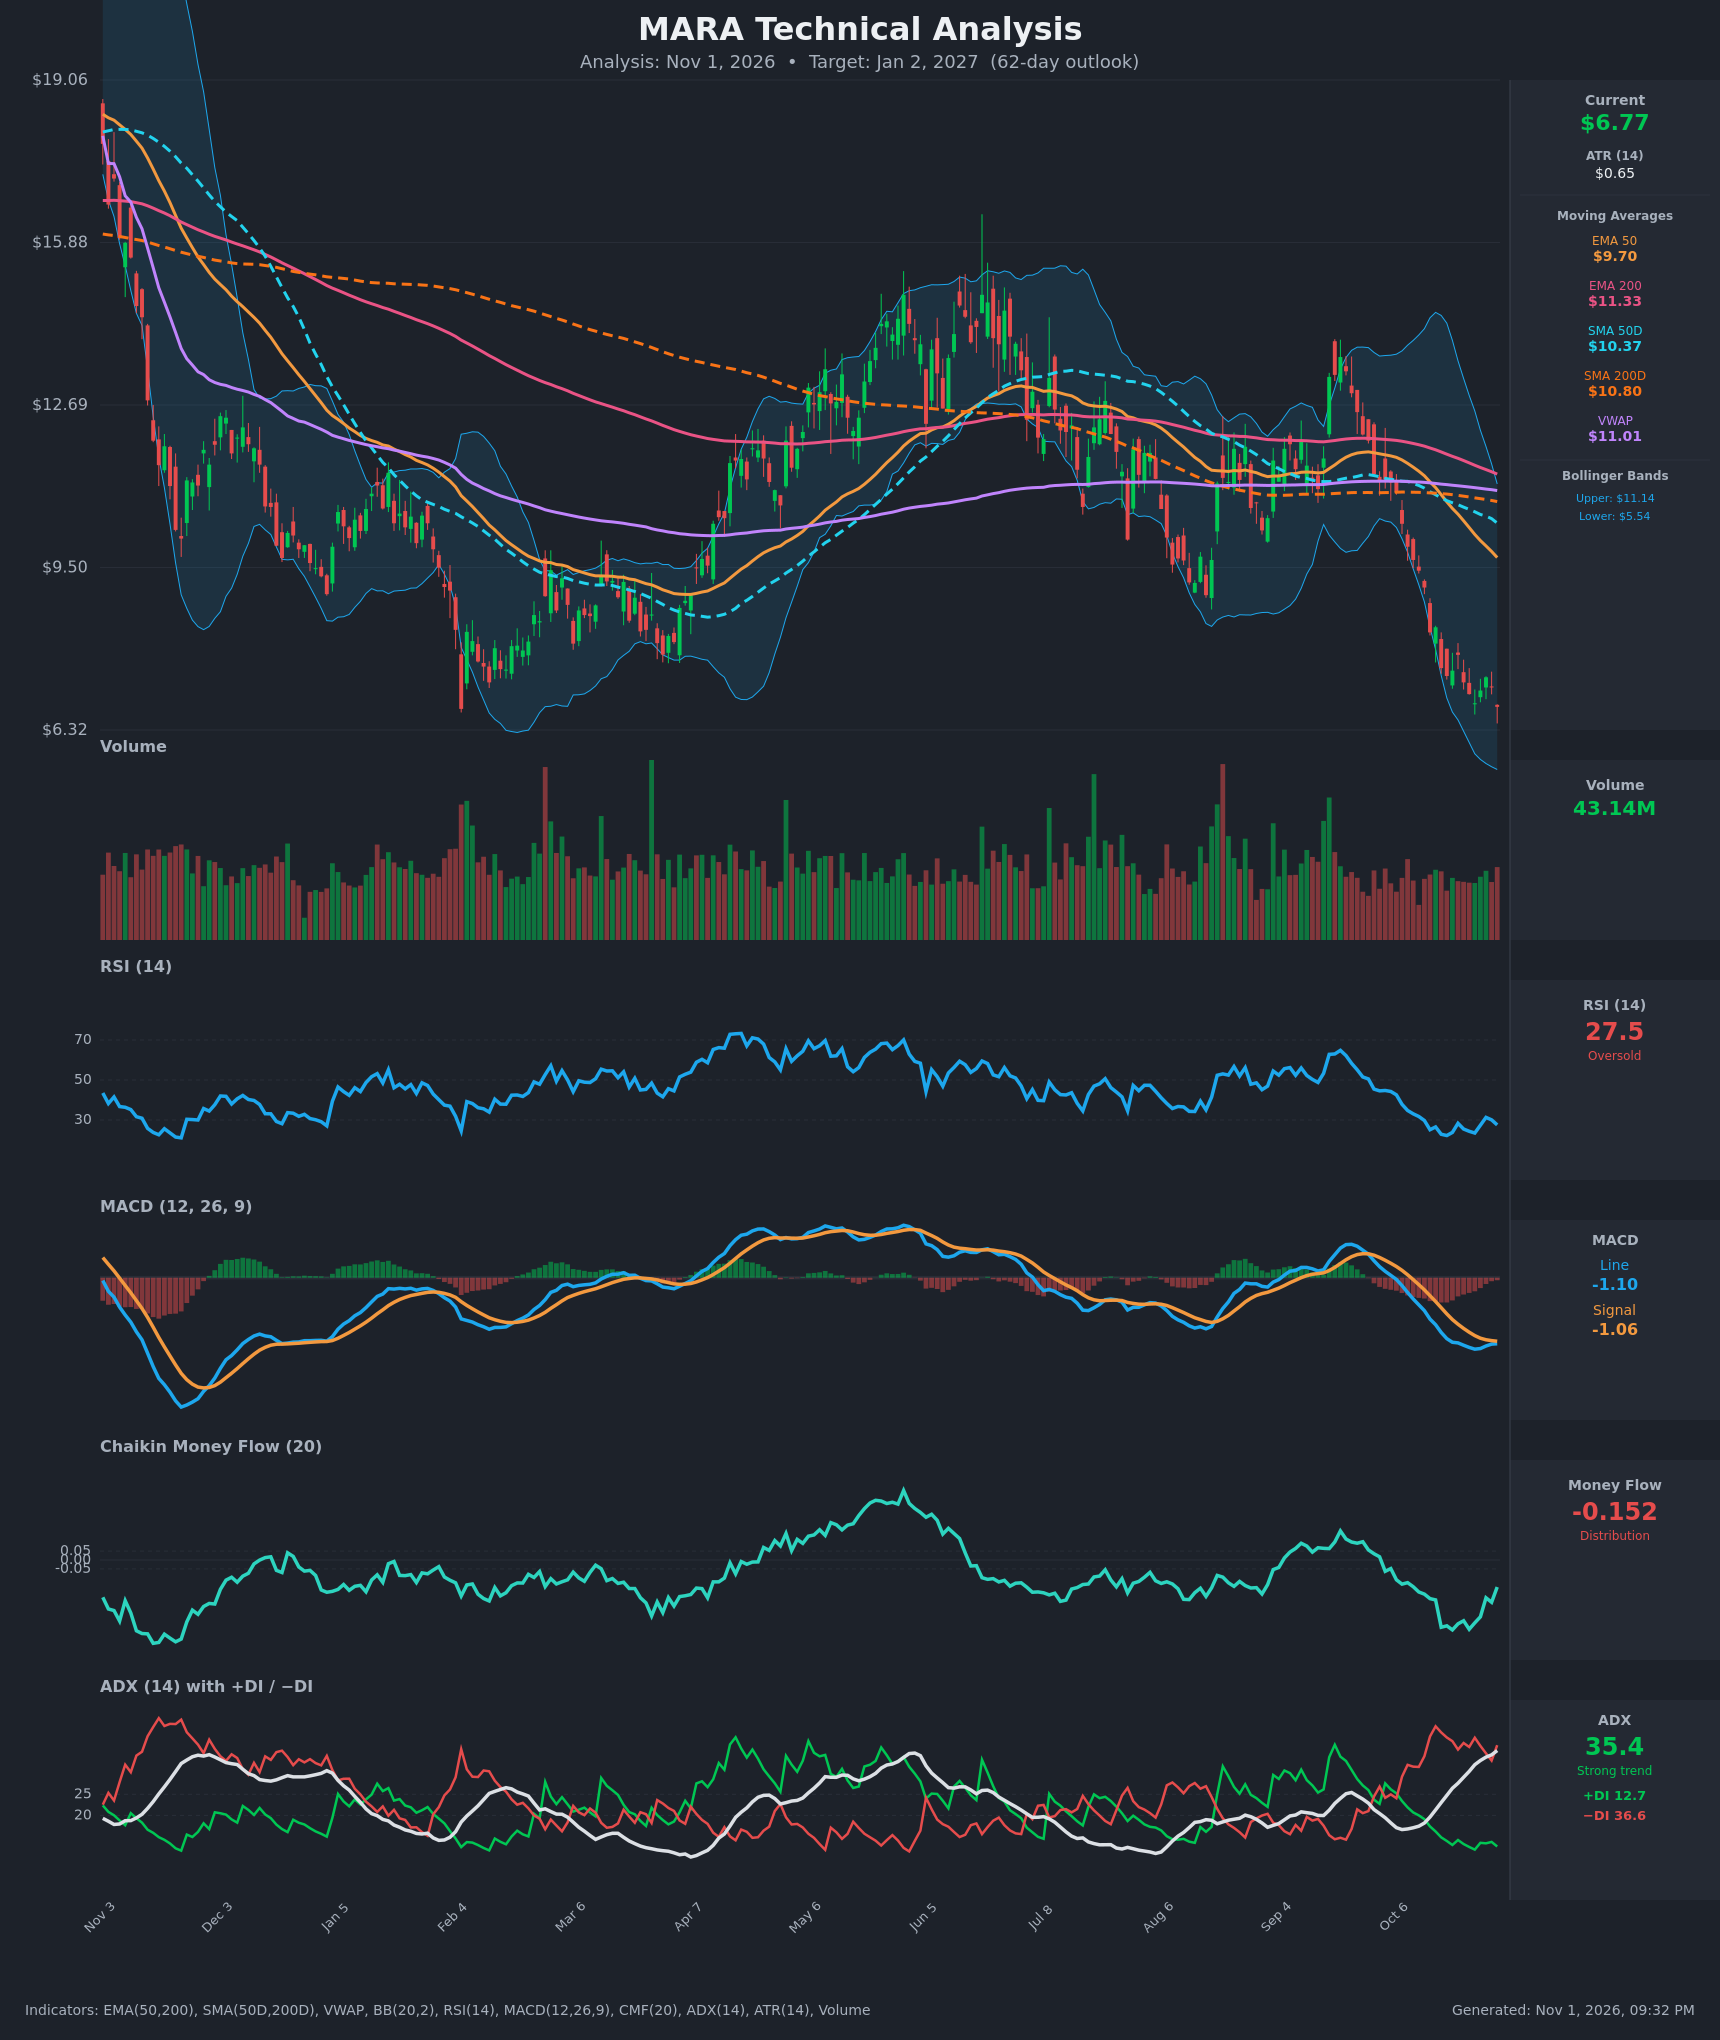
- RSI (14): 27.55, back in oversold territory after bottoming near 22 on Oct 19 and bouncing to about 31 on Oct 28. Momentum is weak, and the latest dip from 30.1 to 27.5 shows the bounce failing. [Bearish]
- 20 EMA: Not provided. The EMA 50 at $9.70 is well above the $6.77 price and falling about $0.11 per day, so it acts as dynamic resistance roughly 43% overhead. The EMA 50 is also below the EMA 200 ($11.33), which confirms a downtrend structure. [Bearish]
- MACD: Line -1.0985 and signal -1.0567, with the line just below the signal. The line crossed below the signal around Oct 11 and the histogram is slightly negative (-0.04). The histogram has narrowed from -0.14 to -0.04, so downside momentum is flattening, but there is no bullish cross yet and both lines are deeply negative. [Bearish]
- Bollinger Bands (20): Upper $11.14, lower $5.54, with price at $6.77 in the lower quarter of the bands. The bands are wide and the price has been walking the lower band during the decline. That reflects a strong trend, and an oversold bounce toward the midline (~$8.34) is possible but not confirmed. [Bearish]
- CMF (20): -0.152, well below -0.05 and sustained negative for the entire 15-bar window (-0.15 to -0.39). It has improved from the -0.39 low, but money flow is still distribution. [Distribution]
- ADX (14): 35.4 and rising steadily from 17.5, with −DI (36.6) far above +DI (12.7). This is a strong, established downtrend with bears firmly in control. [Strong Trend – Bearish]
- Volume: 43.14M, roughly average with no capitulation spike. Declining prices without a washout volume surge suggest the selling may not be exhausted. [Neutral-to-Bearish]
DIVERGENCES & TRENDS
- Divergence: No clear bullish divergence on RSI. RSI made a lower low at 22.2 on Oct 19, then a higher RSI low at 23.5 on Oct 26 while price made a lower low ($6.84 vs $7.38). That is a mild bullish divergence, but the latest reading of 27.5 on a new price low of $6.77 weakens it.
- MACD histogram: It is converging toward the signal line, which signals slowing downside momentum rather than a reversal.
- Moving average structure: Price is far below all moving averages (EMA 50 $9.70, SMA 50 $10.37, SMA 200 $10.80, EMA 200 $11.33, VWAP $11.01). The SMA 50 crossed below the SMA 200 around Oct 12–13 (death cross), which is a major bearish signal.
- Trend: The chart shows a sharp decline from about $13.5 in September to $6.77, with price now below the Feb–Mar lows near $8–9 and near the bottom of the visible range ($6.32 axis floor). Support is largely absent below.
- ADX/DI: −DI has stayed above +DI throughout, and ADX is climbing, which confirms the strengthening trend.
CHART PATTERNS
- Bearish continuation / breakdown: Price broke below the Feb–Mar and Aug–Oct lows (~$8.5–9.0) and is trending down. This resembles a Bearish Pennant/Flag continuation, with the small consolidation near $7.0–$7.8 breaking down on Oct 30 ($6.77). The measured move from the prior leg (~$9.5 to ~$7.4, about $2) projects toward about $5.0–5.5.
- Possible Bullish Falling Wedge: The recent lower highs and lower lows show some narrowing and could form a falling wedge, but there is no confirmed breakout, so it is a lower-probability alternate.
- Lower Bollinger Band (~$5.54) is the first target zone, and ATR ($0.65) implies a typical daily range of about 10%.
POTENTIAL SCENARIOS
- Scenario 1: Bearish Trend Continuation — The strong downtrend (ADX 35, −DI 36.6) continues, with distribution (CMF -0.15) and a death cross keeping rallies capped under the $8.00–$8.50 area. Trigger: daily close below $6.50 and the MACD line staying below signal. Target: $5.00–$5.80. Invalidation: daily close above $8.35 (Bollinger midline/prior resistance). (50% probability)
- Scenario 2: Bullish Oversold Relief Bounce — RSI below 30 and the narrowing MACD histogram trigger a mean-reversion rally toward the Bollinger midline and EMA 50 falling resistance. Trigger: MACD bullish cross and RSI above 35 with a close above $7.80. Target: $8.30–$9.00. Invalidation: close below $6.30. (30% probability)
- Scenario 3: Neutral Basing Range — Price chops sideways as selling exhausts, with no confirmed trend change. Trigger: ADX rolling over from 35 with closes between $6.00 and $7.80. Target: $6.50–$7.30. Invalidation: close outside $5.80–$8.00. (20% probability)
PRICE TARGETS
Timeframe: 62 days (to Jan 2, 2027). Bearish bias with a mean-reversion bounce risk.
- Target Price: $6.10 (for 62 days)
- Expected Range: $4.90 to $7.90 (width $3.00, about 44% of current price, wider than the 18–30% guidance because MARA is highly volatile (ATR about 10% of price) and sits in a strong trend)
- Key Levels: Support at $5.54 (lower Bollinger Band), Resistance at $7.80 (recent bounce high and prior consolidation)
OVERALL BIAS
OVERALL BIAS: BEARISH - Strong downtrend with ADX at 35.4 and −DI far above +DI, price below every major moving average after a death cross, and persistent distribution (CMF -0.15). The oversold RSI and narrowing MACD histogram raise the odds of a relief bounce, but they do not yet show a trend reversal.
This is educational analysis and not financial advice.