IREN 62-day bearish forecast — Nov 1, 2026
- Bias: Bearish
- Timeframe: 62 days (made Nov 1, 2026, target date Jan 1, 2027)
- Price at analysis: $23.95
- Price target: $21.50
- Expected range: $18.00 – $25.00
- Result: Pending — graded after the close on Jan 1, 2027
Get a free AI analysis of IREN today
Analysis
TECHNICAL INDICATORS
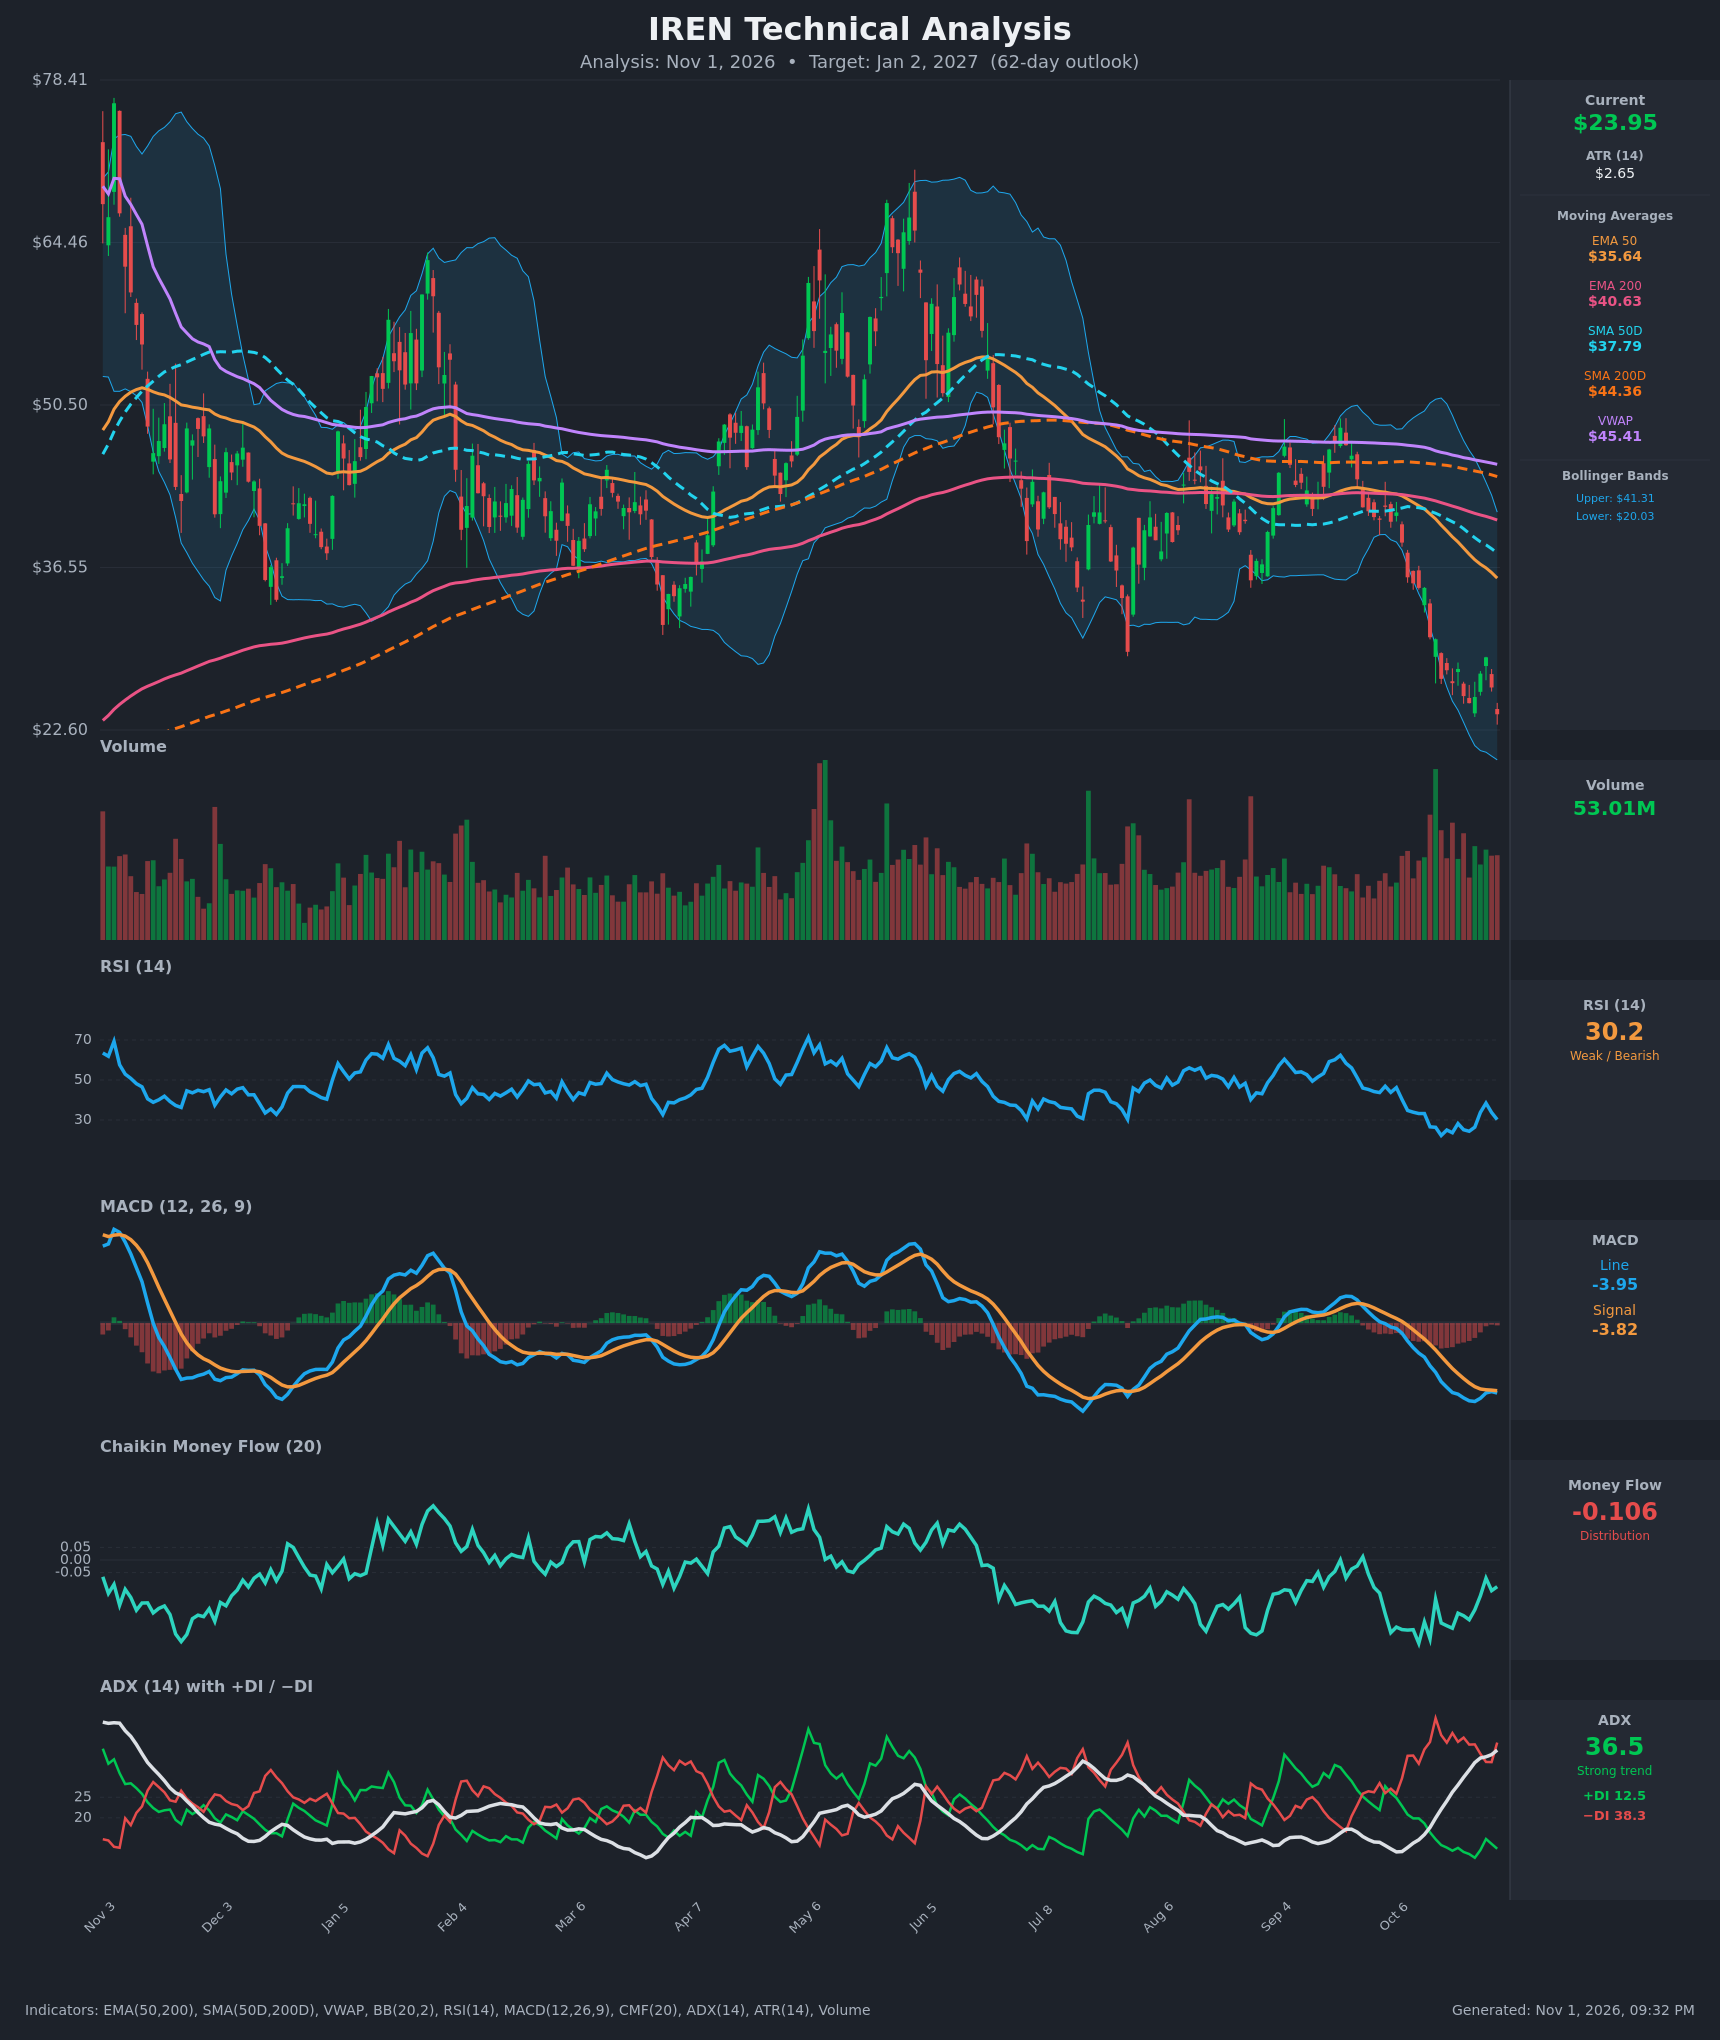
- RSI (14): 30.20, right at the oversold threshold. It bottomed at 22.2 on Oct 16, bounced to 38.4 on Oct 28, and has rolled over again. Momentum is still down, but the reading is stretched. [Bearish]
- 20 EMA: The 20 EMA isn't supplied. The Bollinger midline (20-period average, roughly $30.7) sits well above price, and EMA50 ($35.64) is far overhead and falling. Price is below every average, so rallies run into resistance. [Bearish]
- MACD: Line -3.953 is below signal -3.823, a histogram of about -0.13. It was nearly flat on Oct 28-29, so the bearish cross has just re-asserted itself. Both lines are deeply negative and well below zero. [Bearish]
- Bollinger Bands (20): Upper $41.31, lower $20.03. Price at $23.95 is in the lower third of the bands, near the lower band, which is still falling and expanding. This is a "walking the band" downtrend, not yet a confirmed reversal. [Bearish]
- CMF (20): -0.106, below the -0.05 threshold. It has been negative for most of the past months, with only a brief rally toward -0.07. That shows persistent distribution. [Distribution]
- ADX (14): 36.5 and rising, with -DI (38.3) far above +DI (12.5). The trend is strong and firmly bearish, and the DI spread is wide. [Strong Trend – Bearish]
- Volume: 53.01M, elevated versus the long-run average. Volume spikes on red candles during the Oct decline point to active selling and capitulation-style participation. There is no clear exhaustion spike yet. [Bearish – selling pressure]
DIVERGENCES & TRENDS
- Mild bullish RSI divergence: price made a lower low ($23.95 vs $24.91 on Oct 23), while RSI (30.2) sits above its Oct 16 low (22.2). This hints at fading downside momentum but is not confirmed.
- Moving averages: the SMA50D ($37.79) crossed below the SMA200D ($44.36) well before this window, so the death cross is already in force. EMA50 ($35.64) is below EMA200 ($40.63) and the gap is widening. Price is far below SMA200D, a confirmed long-term downtrend.
- VWAP: at $45.41, price is about 47% below it, which means heavy overhead supply.
- MACD: it re-crossed below signal on Oct 30 after nearly converging, a bearish continuation signal.
- ADX/DI: -DI has been above +DI for the whole decline, and ADX is climbing through 25 toward 36.5, confirming trend strength rather than exhaustion.
- Price: lower highs and lower lows since the Sep peak, with a failed bounce at $28.84 on Oct 28.
CHART PATTERNS
- Bearish Flag/Pennant (continuation): since Oct 16, price has consolidated in a narrow range of roughly $24.9–$28.8 after a sharp drop from about $35 to $27. Today's close at $23.95 breaks below the consolidation low. A measured move of the prior leg (about $8-10) projects toward about $16-18 on a full extension.
- Bearish context: the larger structure since the June peak is a series of lower highs, consistent with a broad descending structure.
- Counter-signal: a close below the lower Bollinger Band area with RSI near 30 raises the odds of a relief bounce, which would probably fade near $28-29.
POTENTIAL SCENARIOS
- Scenario 1: Bearish Trend Continuation — The flag breakdown extends, with price making lower lows as ADX stays above 30 and CMF stays negative. Trigger: daily close below $23.50 on sustained volume. Target: $20.00–$21.50, with an extended move toward $18. Invalidation: daily close above $28.84. (52% probability)
- Scenario 2: Bullish Oversold Relief Bounce — RSI divergence and the lower Bollinger Band lead to a mean-reversion rally toward the BB midline and prior breakdown area. Trigger: reclaim of $27.44 with MACD histogram turning positive. Target: $28.80–$31.00. Invalidation: close below $20.03. (33% probability)
- Scenario 3: Neutral Base Building — Price chops between about $20 and $27 as selling exhausts and ADX fades. Trigger: ADX rolling over below 30 with CMF moving back toward zero. Target: $22–$26. Invalidation: close outside $19.50–$28.00. (15% probability)
PRICE TARGETS
- Target Price: $21.50 (62-day horizon, about Jan 2, 2027)
- Expected Range: $18.00 to $25.00 (width $7.00, about 29% of current price, consistent with the 18–30% guidance for 61–180 days)
- Key Levels: Support at $20.03 (lower Bollinger Band), Resistance at $28.84 (Oct 28 bounce high)
OVERALL BIAS
OVERALL BIAS: BEARISH - The stock sits below all major moving averages, with the death cross already in place, ADX at 36.5 and −DI dominant, MACD below signal, and CMF showing distribution. The oversold RSI and mild divergence raise the risk of a relief bounce, but the trend evidence favors further downside.
This is educational analysis and not financial advice.