MSTR 62-day bearish forecast — Nov 1, 2026
- Bias: Bearish
- Timeframe: 62 days (made Nov 1, 2026, target date Jan 1, 2027)
- Price at analysis: $130.51
- Price target: $121.00
- Expected range: $106.00 – $138.00
- Result: Pending — graded after the close on Jan 1, 2027
Get a free AI analysis of MSTR today
Analysis
TECHNICAL INDICATORS
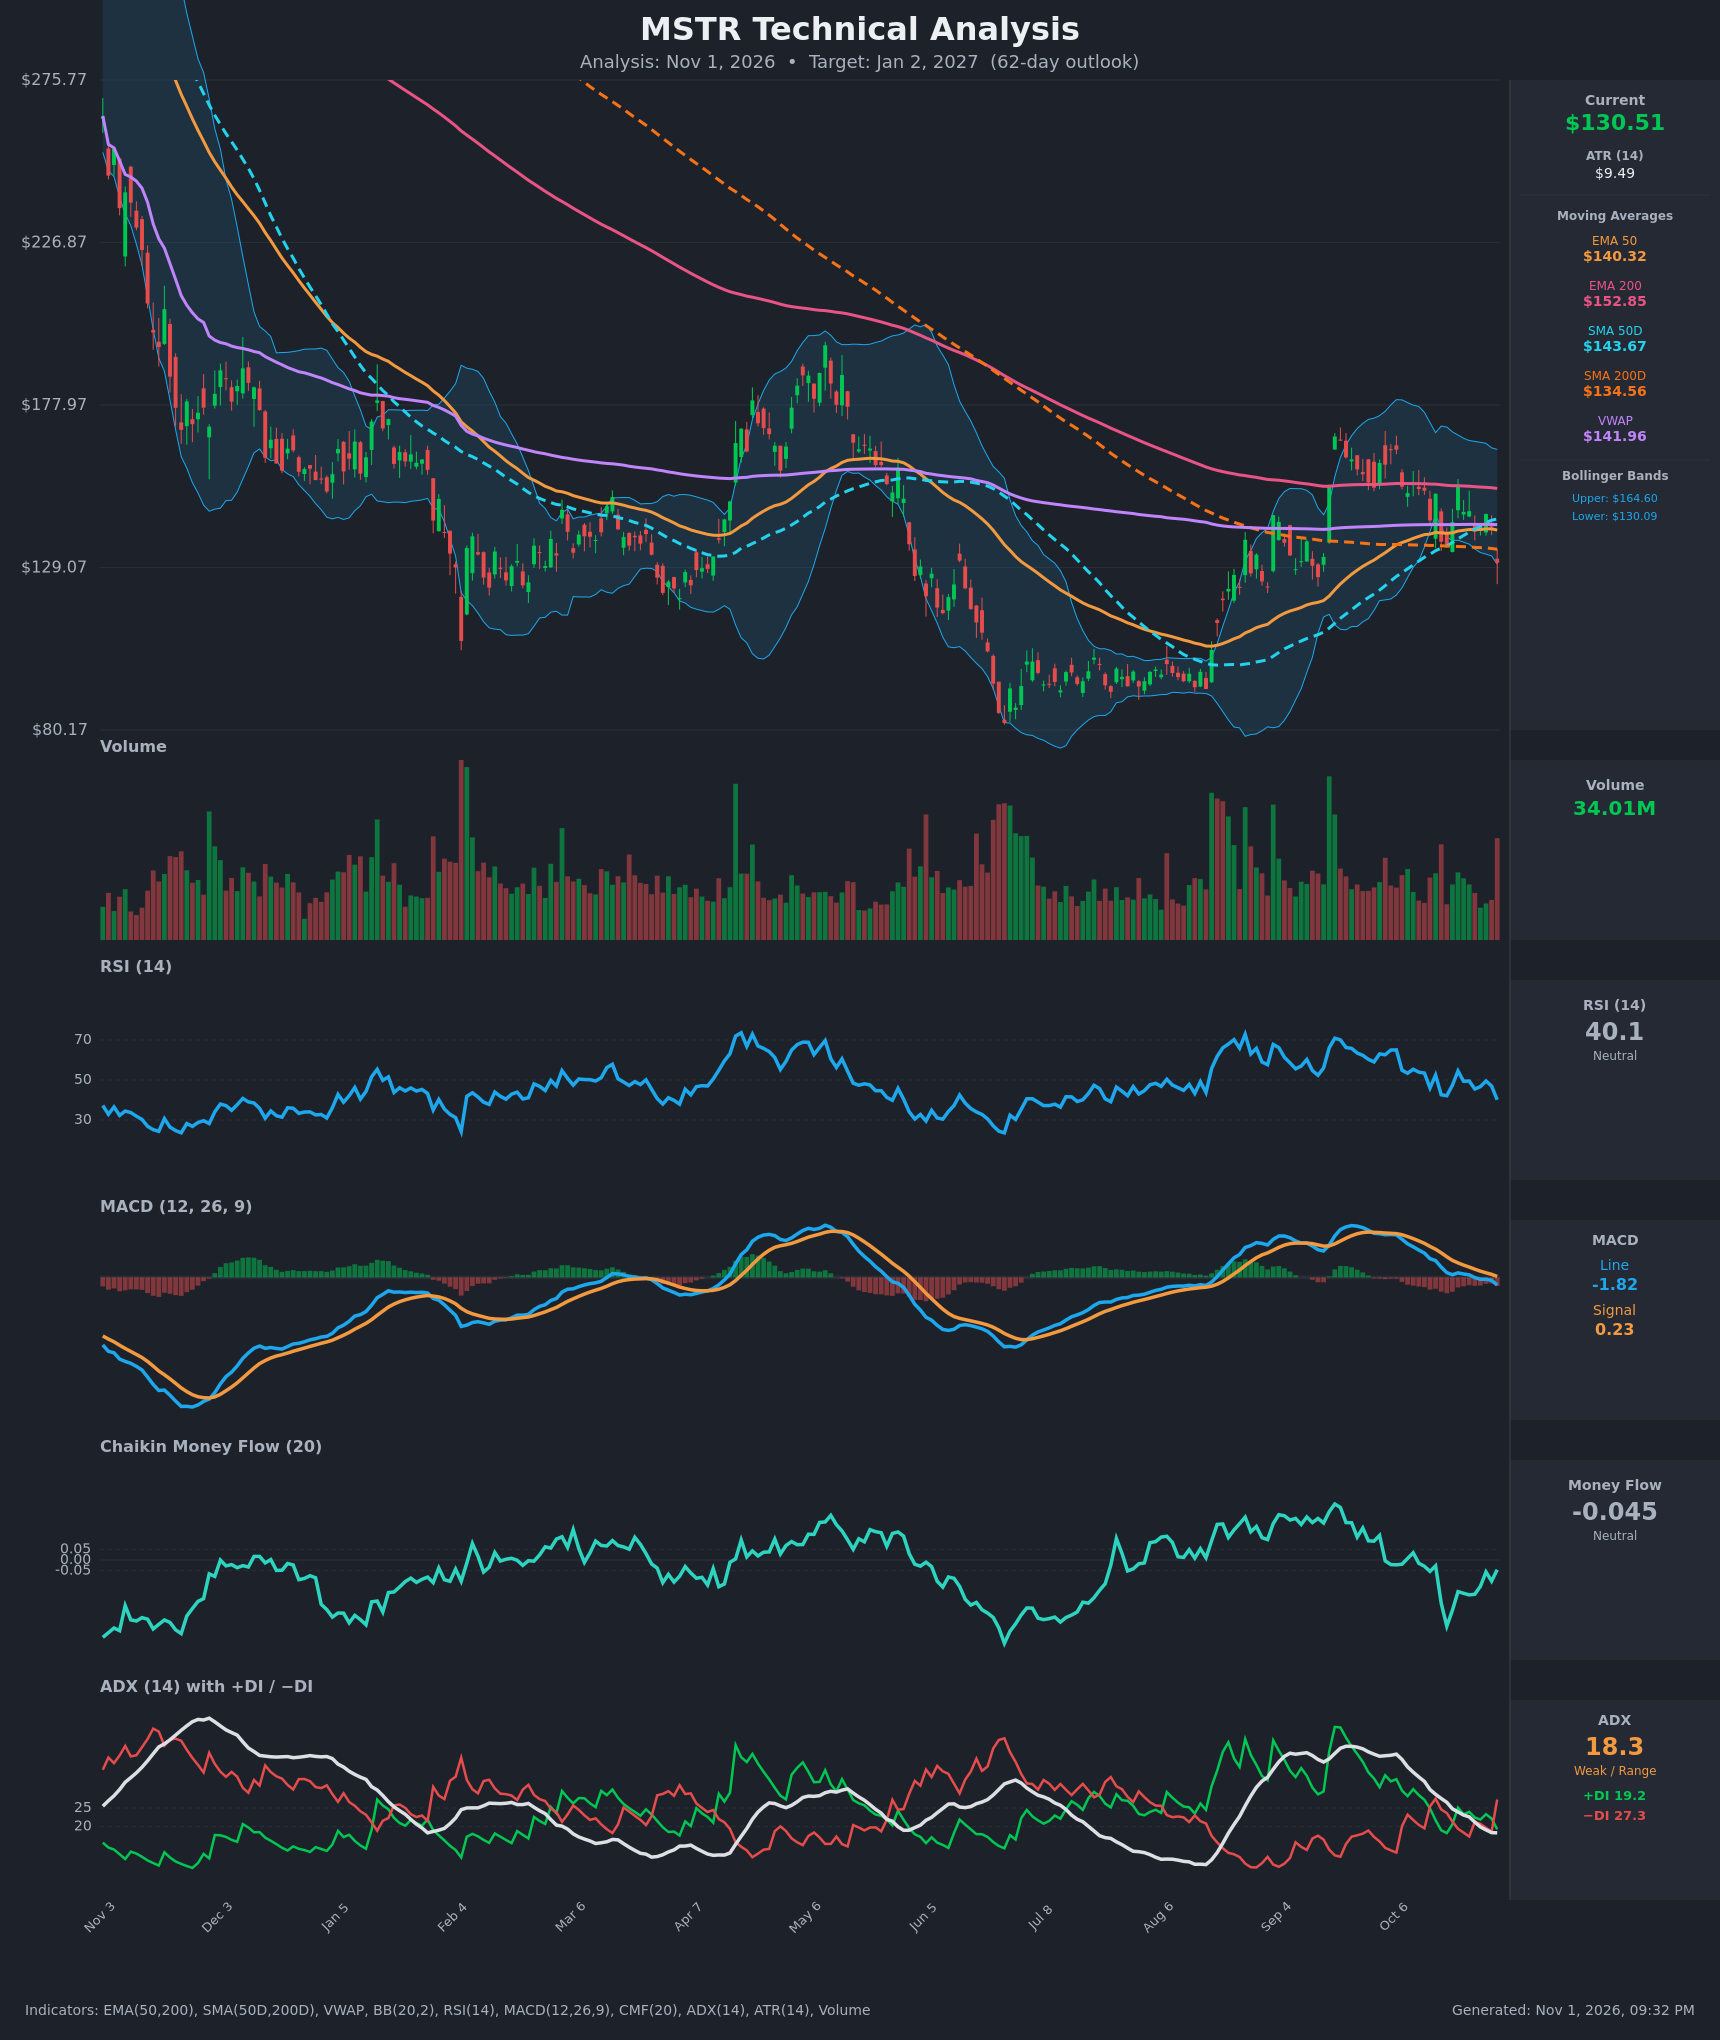
- RSI (14): 40.11, down from about 49 a few sessions ago and the lowest reading since mid-October. It is below the 50 midline and not yet oversold, so there is room to fall further. Momentum is turning down. [Bearish]
- 20 EMA: The 20 EMA is not provided. Price at $130.51 is below the EMA 50 ($140.32), which is now flat to slightly lower, and well below the EMA 200 ($152.85). Price closed about 7% under the 50 EMA after a sharp one-day drop. The EMAs are overhead resistance, and EMA 50 remains below EMA 200, so no bullish EMA crossover has occurred. [Bearish]
- MACD: The line is at -1.82 and the signal at +0.23. The line crossed below the signal around Oct 26-27 and is now below zero, with the gap widening (histogram about -2.05 and expanding). This is a fresh bearish crossover with accelerating downside momentum. [Bearish]
- Bollinger Bands (20): The upper band is $164.61 and the lower $130.09, so price at $130.51 sits right on the lower band after a -7.8% day. A close at or below the lower band signals a downside expansion, though it can also lead to a short-term bounce. In a weak-ADX environment, a mean-reversion bounce toward the mid-band (about $147) is possible. The bands are still wide. [Bearish]
- CMF (20): -0.045 sits in the neutral zone but just inside the distribution threshold. It has been negative for the whole 15-bar window and dipped to -0.31 on Oct 19. There is no accumulation, and selling pressure is persistent but mild. [Neutral]
- ADX (14): 18.3, which is weak or range-bound and falling from 33 on Oct 12. −DI (27.3) has just jumped back above +DI (19.2) after a near-converged reading, a bearish DI crossover. The trend is weak, but direction is tilting down. [Weak Trend, Bearish Direction]
- Volume: 34.01M on the latest red bar, one of the heavier recent sessions and the highest of the past several weeks. Heavy volume on a breakdown candle confirms selling conviction. [Bearish Confirmation]
Other moving averages and levels:
- Price is below VWAP ($141.96), a sign of sellers in control.
- Price is below SMA 200D ($134.56) for the first time in about 2.5 months, a loss of long-term support.
- SMA 50D ($143.67) is above SMA 200D, so the golden cross is intact. But SMA 50D is flattening and nearly touching price action, which weakens that signal.
DIVERGENCES & TRENDS
- There is no clear divergence. RSI and MACD are confirming the price decline rather than diverging.
- Over the past 15 bars, MACD fell from +6.56 to -1.82 and its signal line decayed from 8.75 to 0.23. That is a persistent loss of momentum since the early-October peak.
- Price made lower highs ($153.48 on Oct 21 versus roughly $170 in September) and has now broken the low of the October range ($136), a short-term lower-low structure.
- RSI has made lower highs since the September peak above 70, so momentum has been deteriorating for weeks.
- ADX has fallen from over 30 to 18 while −DI crosses back above +DI. The prior uptrend is exhausted, and a new bearish trend is only starting.
- Price has lost SMA 200D, EMA 50, and VWAP at roughly the same time. This is a cluster of lost support.
CHART PATTERNS
- Bearish Double Top / Lower-High Structure: The September peak (about $170) and the October peak ($153) form a lower-high double-top-style structure. The "neckline" is around the $130-135 zone, which has now been broken on heavy volume. The full measured move (about $40 of height) would point toward about $90-95, matching the prior consolidation base. I treat that as a stretch target for the 62-day window, not the base case.
- Range Breakdown: Price chopped between about $136 and $153 for most of October. It has now closed below the range floor with a sharp drop, a bearish rectangle or flag breakdown.
- Risk to the pattern: The big down candle sits right on the lower Bollinger Band and at the SMA 200D. A fast reclaim of $136-$140 would turn this into a false breakdown or bear trap.
POTENTIAL SCENARIOS
- Scenario 1: Bearish Range Breakdown Continuation — The loss of SMA 200D, EMA 50, VWAP and the lower band on heavy volume, plus the new MACD and DI bearish crossovers, point to a drift lower toward prior support. Trigger: daily close below $128 with continued −DI dominance. Target: $118-$121 first, then $105-$110 if the breakdown accelerates. Invalidation: daily close back above $141 (VWAP/EMA 50). (50% probability)
- Scenario 2: Bullish Bear-Trap Reclaim — Price bounces from the lower Bollinger Band, reclaims SMA 200D ($134.56), and rotates back to the mid-range. Trigger: close above $136 and then $141.96 (VWAP) with a rising CMF. Target: $147-$153 (Bollinger mid-band and the October highs). Invalidation: close below $126. (30% probability)
- Scenario 3: Neutral Chop Around the Moving Average Cluster — With ADX under 20, price stays pinned between roughly $120 and $142 around the converged SMA 200D, SMA 50D and EMA 50. Trigger: ADX stays below 20 and RSI holds 40-50. Target: $128-$135. Invalidation: close outside the $120-$142 range. (20% probability)
PRICE TARGETS
- Target Price: $121.00 (62 days, about -7.3% from $130.51)
- Expected Range: $106.00 to $138.00 (width $32 = about 24.5% of price, consistent with the 61-180 day guidance)
- Key Levels: Support at $118.00 (prior spring lows), Resistance at $140.32 (EMA 50, with SMA 50D at $143.67 just above)
OVERALL BIAS
OVERALL BIAS: BEARISH - Price has broken below SMA 200D, EMA 50, VWAP and the lower Bollinger Band on heavy volume. MACD and the DI lines have just crossed bearishly, and RSI is falling with room before oversold. The weak ADX and a possible bear-trap bounce limit conviction, but the evidence leans lower.
This is educational analysis and not financial advice.