NIO 62-day bearish forecast — Nov 1, 2026
- Bias: Bearish
- Timeframe: 62 days (made Nov 1, 2026, target date Jan 1, 2027)
- Price at analysis: $3.21
- Price target: $2.95
- Expected range: $2.60 – $3.40
- Result: Pending — graded after the close on Jan 1, 2027
Get a free AI analysis of NIO today
Analysis
TECHNICAL INDICATORS
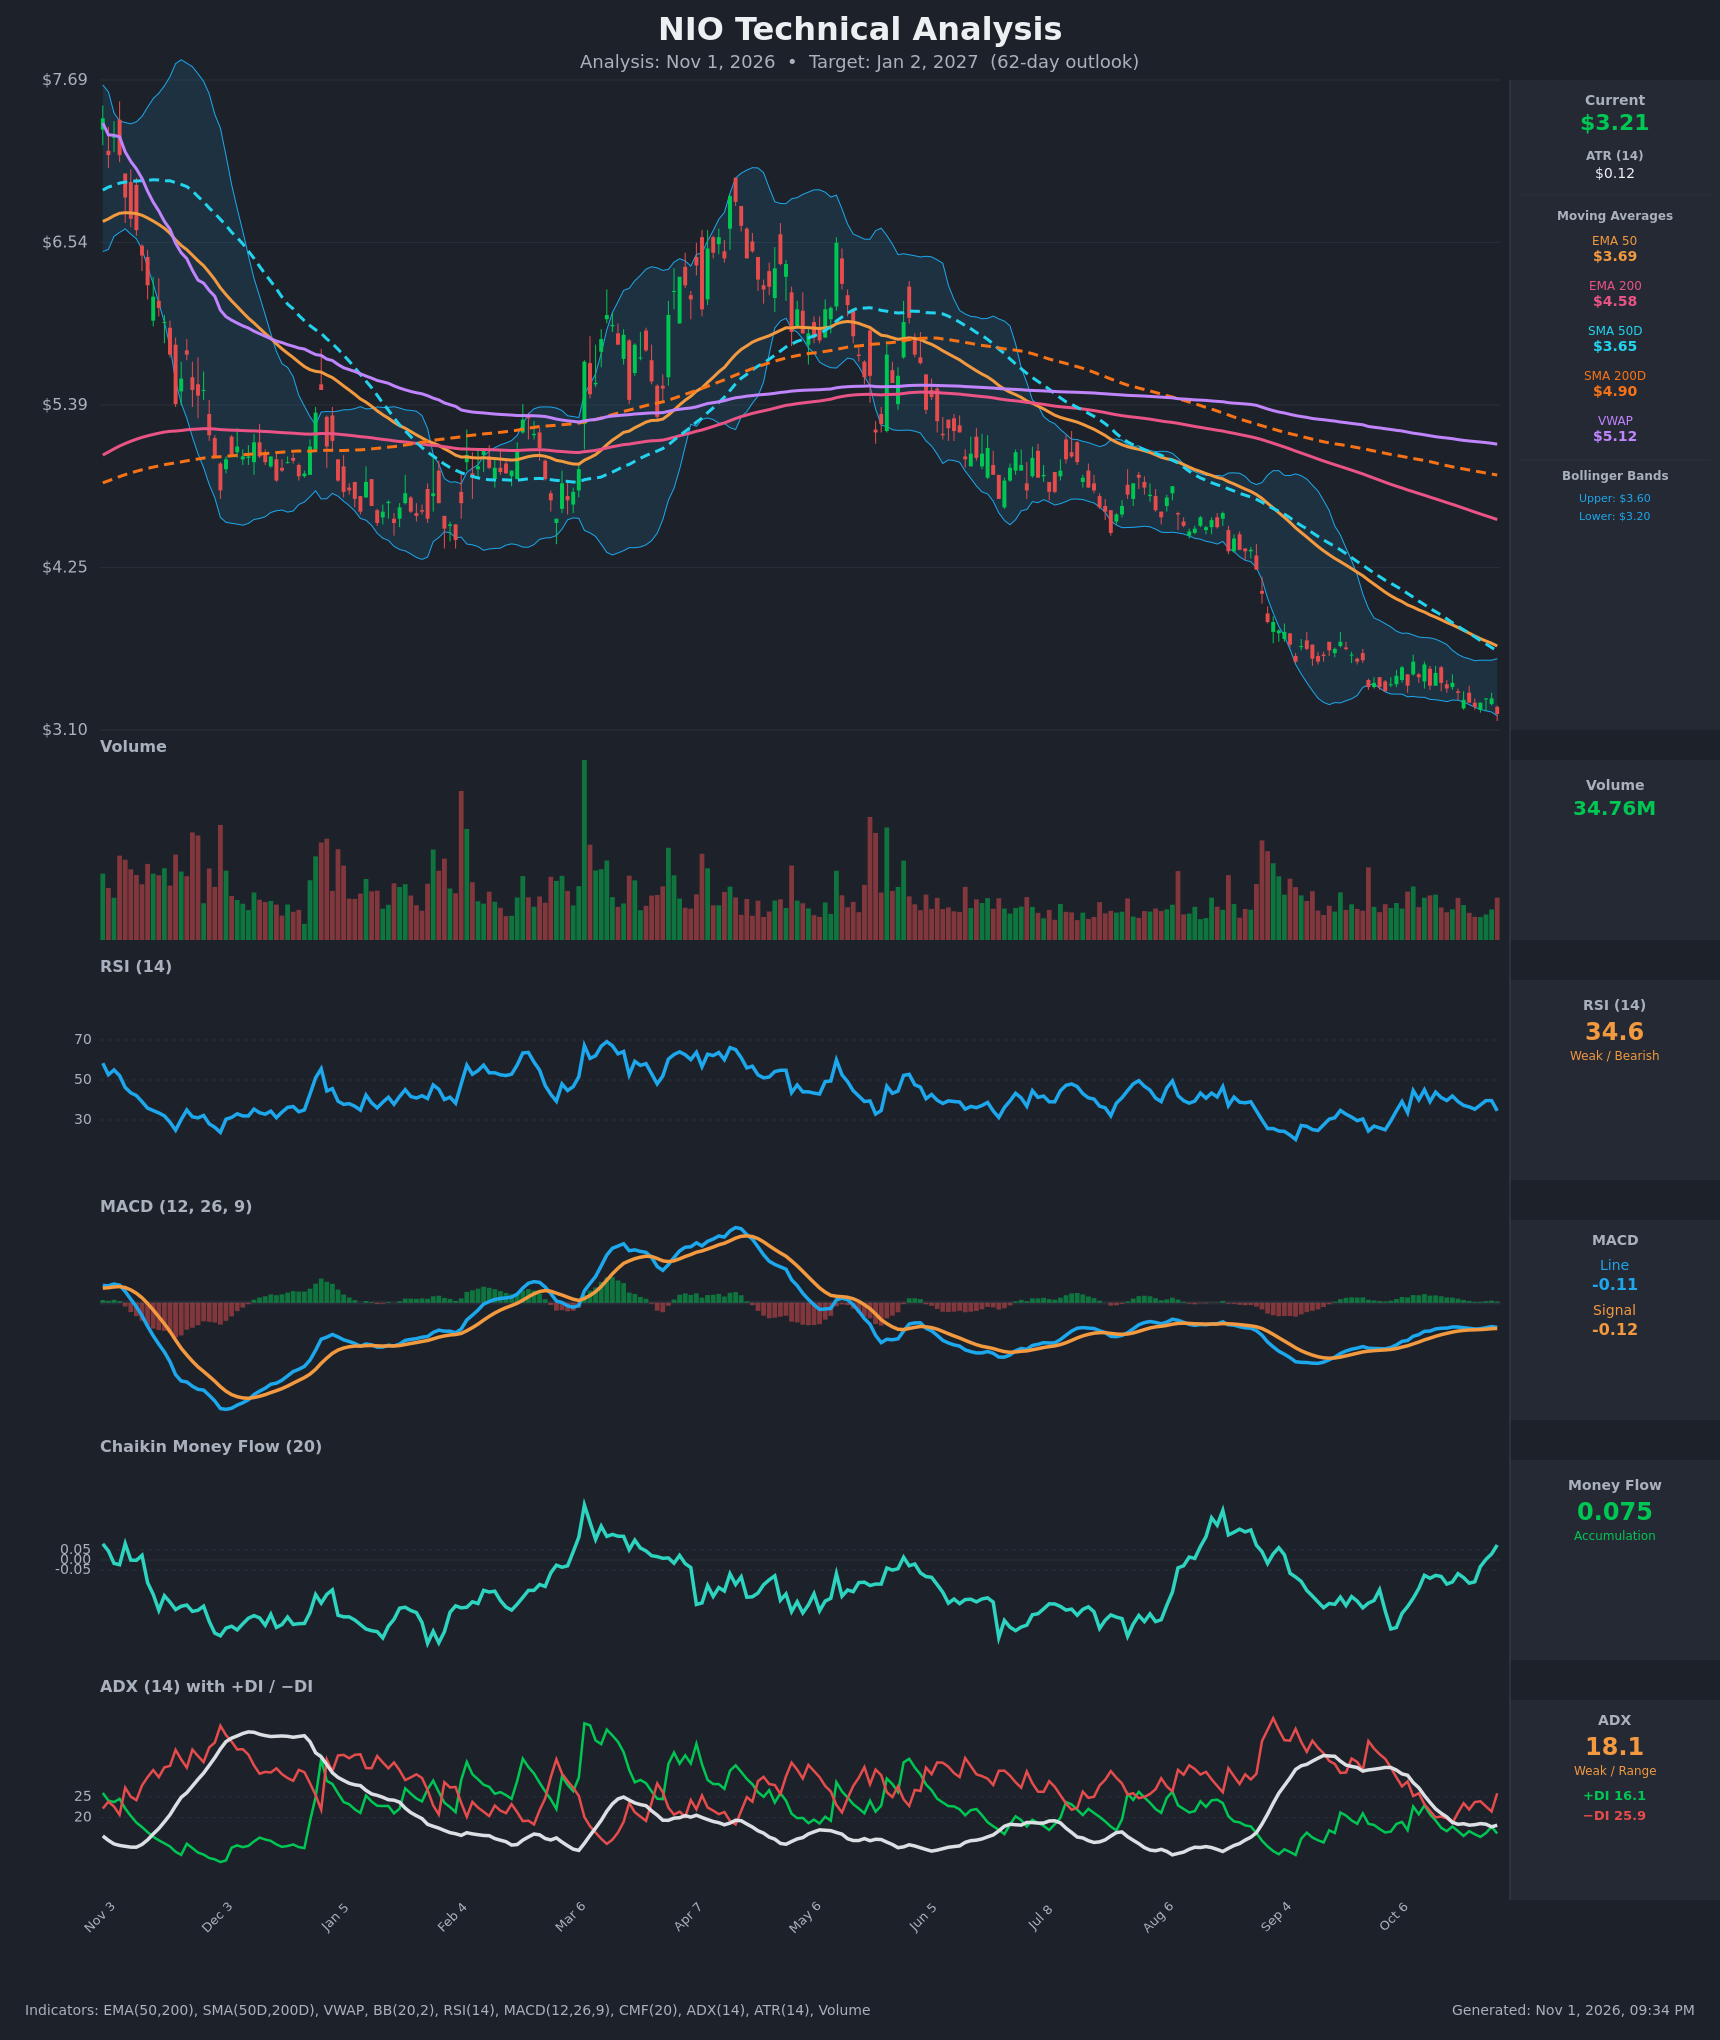
- RSI (14): 34.60, close to oversold (<30) but not there. It has rolled over from 39.7 two days ago, and the chart shows RSI making lower highs since the Aug-Sep rally. Momentum is weak and still falling. [Bearish]
- 20 EMA: No 20 EMA is supplied. The 50 EMA at $3.69 and the 50-day SMA at $3.65 are the nearest dynamic resistance, 13-14% above price. Price has closed below the 50 EMA for the whole visible stretch, and the EMA is still sloping down. [Bearish]
- MACD: Line -0.112 and signal -0.117, so the histogram is marginally positive at about +0.005. Both lines are below zero and nearly flat, and the line turned down on the last bar after hovering just above the signal. This is a weak, fading attempt at a bullish cross, not real upside momentum. [Neutral]
- Bollinger Bands (20): Price of $3.21 sits at the lower band ($3.1971), with the upper band at $3.60. Bands are contracting after the Sep-Oct breakdown. Price has been riding the lower half of the bands, which is typical of a persistent downtrend. A band-walk at fresh lows can mean stretched conditions, but it is not a reversal signal on its own. [Bearish]
- CMF (20): +0.075 and rising for several sessions, up from about -0.12 on Oct 19-23. This is mild accumulation, the main bullish divergence on the chart. It is a recent turn and not yet confirmed by price. [Accumulation]
- ADX (14): 18.1, below 20, so trend strength is weak. −DI (25.9) is well above +DI (16.1) and has widened over the last few bars. The bears control direction, but the sell-off is losing trend intensity, which fits a grinding or basing market. [Weak Trend, bearish direction]
- Volume: 34.76M, unremarkable and well below the spikes seen during the Sep sell-off. Selling is not accelerating, but there is no capitulation volume or buying surge either. [Neutral / no confirmation of a reversal]
DIVERGENCES & TRENDS
- Moving-average structure: Price ($3.21) is below EMA50 ($3.69), EMA200 ($4.58), SMA50D ($3.65), SMA200D ($4.90) and VWAP ($5.12). EMA50 is below EMA200, and SMA50D is far below SMA200D, so a death cross is already in place. This is a mature long-term downtrend with all averages sloping down.
- Bullish divergence (minor): CMF has climbed from -0.12 to +0.075 while price made lower lows ($3.39 to $3.21). RSI and MACD, however, have not confirmed with higher lows, so this divergence is only partial.
- Trend decay: ADX has fallen from 27 to 18 over the last 15 bars, so the selling is losing force. Price still made a new low on the last bar, with −DI jumping from 21.5 to 25.9.
- Crossovers: MACD has been marginally above its signal since mid-October, but the gap is tiny and the line is flattening. There is no bullish DI crossover, and the DI spread is widening against the bulls.
- Price structure: A tight 3.26-3.56 consolidation over the last 2-3 weeks has just broken to the downside, with a close at $3.21 and a new low.
CHART PATTERNS
- Bearish Pennant / Bearish Flag (continuation): After the Sep drop from about $4.50 to $3.60, price formed a narrow sideways-to-slightly-lower consolidation. The latest bar's close below the base is consistent with the bearish continuation breakdown. The measured move is the prior flagpole (~$0.90) projected from the breakdown, which points toward $2.60-2.80. That is the extreme target, and I discount it given weak ADX.
- Bullish Falling Wedge (reversal, lower probability): Lower highs and lows with contracting volatility and a rising CMF could be a falling wedge. It needs a close above about $3.45-3.60 (the wedge top, the upper band and the 50-day SMA) to confirm. Until then it is a minority scenario.
- Larger context: The multi-month structure is a descending channel with lower highs ($6.9 to $5.8 to $4.6 to $3.6). Any bounce is likely to meet heavy overhead resistance.
POTENTIAL SCENARIOS
- Scenario 1: Bearish Pennant Breakdown Continuation — Price breaks below the 3.26-3.20 base, with −DI dominant and all averages sloping down, and grinds lower in a slow trend. Trigger: sustained closes below $3.19 (the lower band). Target: $2.95 initially, with extension to $2.65-2.75. Invalidation: a daily close above $3.45. (45% probability)
- Scenario 2: Bullish Oversold Mean-Reversion Bounce — CMF accumulation and an RSI near 30 trigger a relief rally back toward the declining 50-day SMA/EMA. Trigger: reclaim of $3.45 with expanding volume and a MACD move toward zero. Target: $3.60-3.70, with a possible stretch to $3.90. Invalidation: a close below $3.10 after the bounce fails. (33% probability)
- Scenario 3: Neutral Base-Building Range — Falling ADX and positive CMF produce a sideways range of about $3.00-$3.50 for the whole period. Trigger: repeated holds above $3.10 with no breakout of the range. Target: about $3.20-3.30. Invalidation: a decisive break of either $3.00 or $3.55. (22% probability)
PRICE TARGETS
- Target Price: $2.95 (62 days, Jan 2, 2027)
- Expected Range: $2.60 to $3.40 (width $0.80, about 25% of the current price, consistent with the 18-30% guidance for 61-180 days)
- Key Levels: Support at $3.00, Resistance at $3.45
The range is wide enough to include a relief bounce toward $3.40. The target sits below current price because of the ongoing downtrend, the breakdown below the recent base and −DI dominance, tempered by weak ADX and improving CMF.
OVERALL BIAS
OVERALL BIAS: BEARISH - Price sits below every major average after a death cross, has just broken below its multi-week consolidation base, and −DI is well above +DI. The CMF uptick and weak ADX argue for a slow grind with relief bounces, not a collapse, so conviction is modest.
This is educational analysis and not financial advice.