QUBT 62-day bearish forecast — Nov 1, 2026
- Bias: Bearish
- Timeframe: 62 days (made Nov 1, 2026, target date Jan 1, 2027)
- Price at analysis: $6.60
- Price target: $5.85
- Expected range: $5.30 – $7.20
- Result: Pending — graded after the close on Jan 1, 2027
Get a free AI analysis of QUBT today
Analysis
TECHNICAL INDICATORS
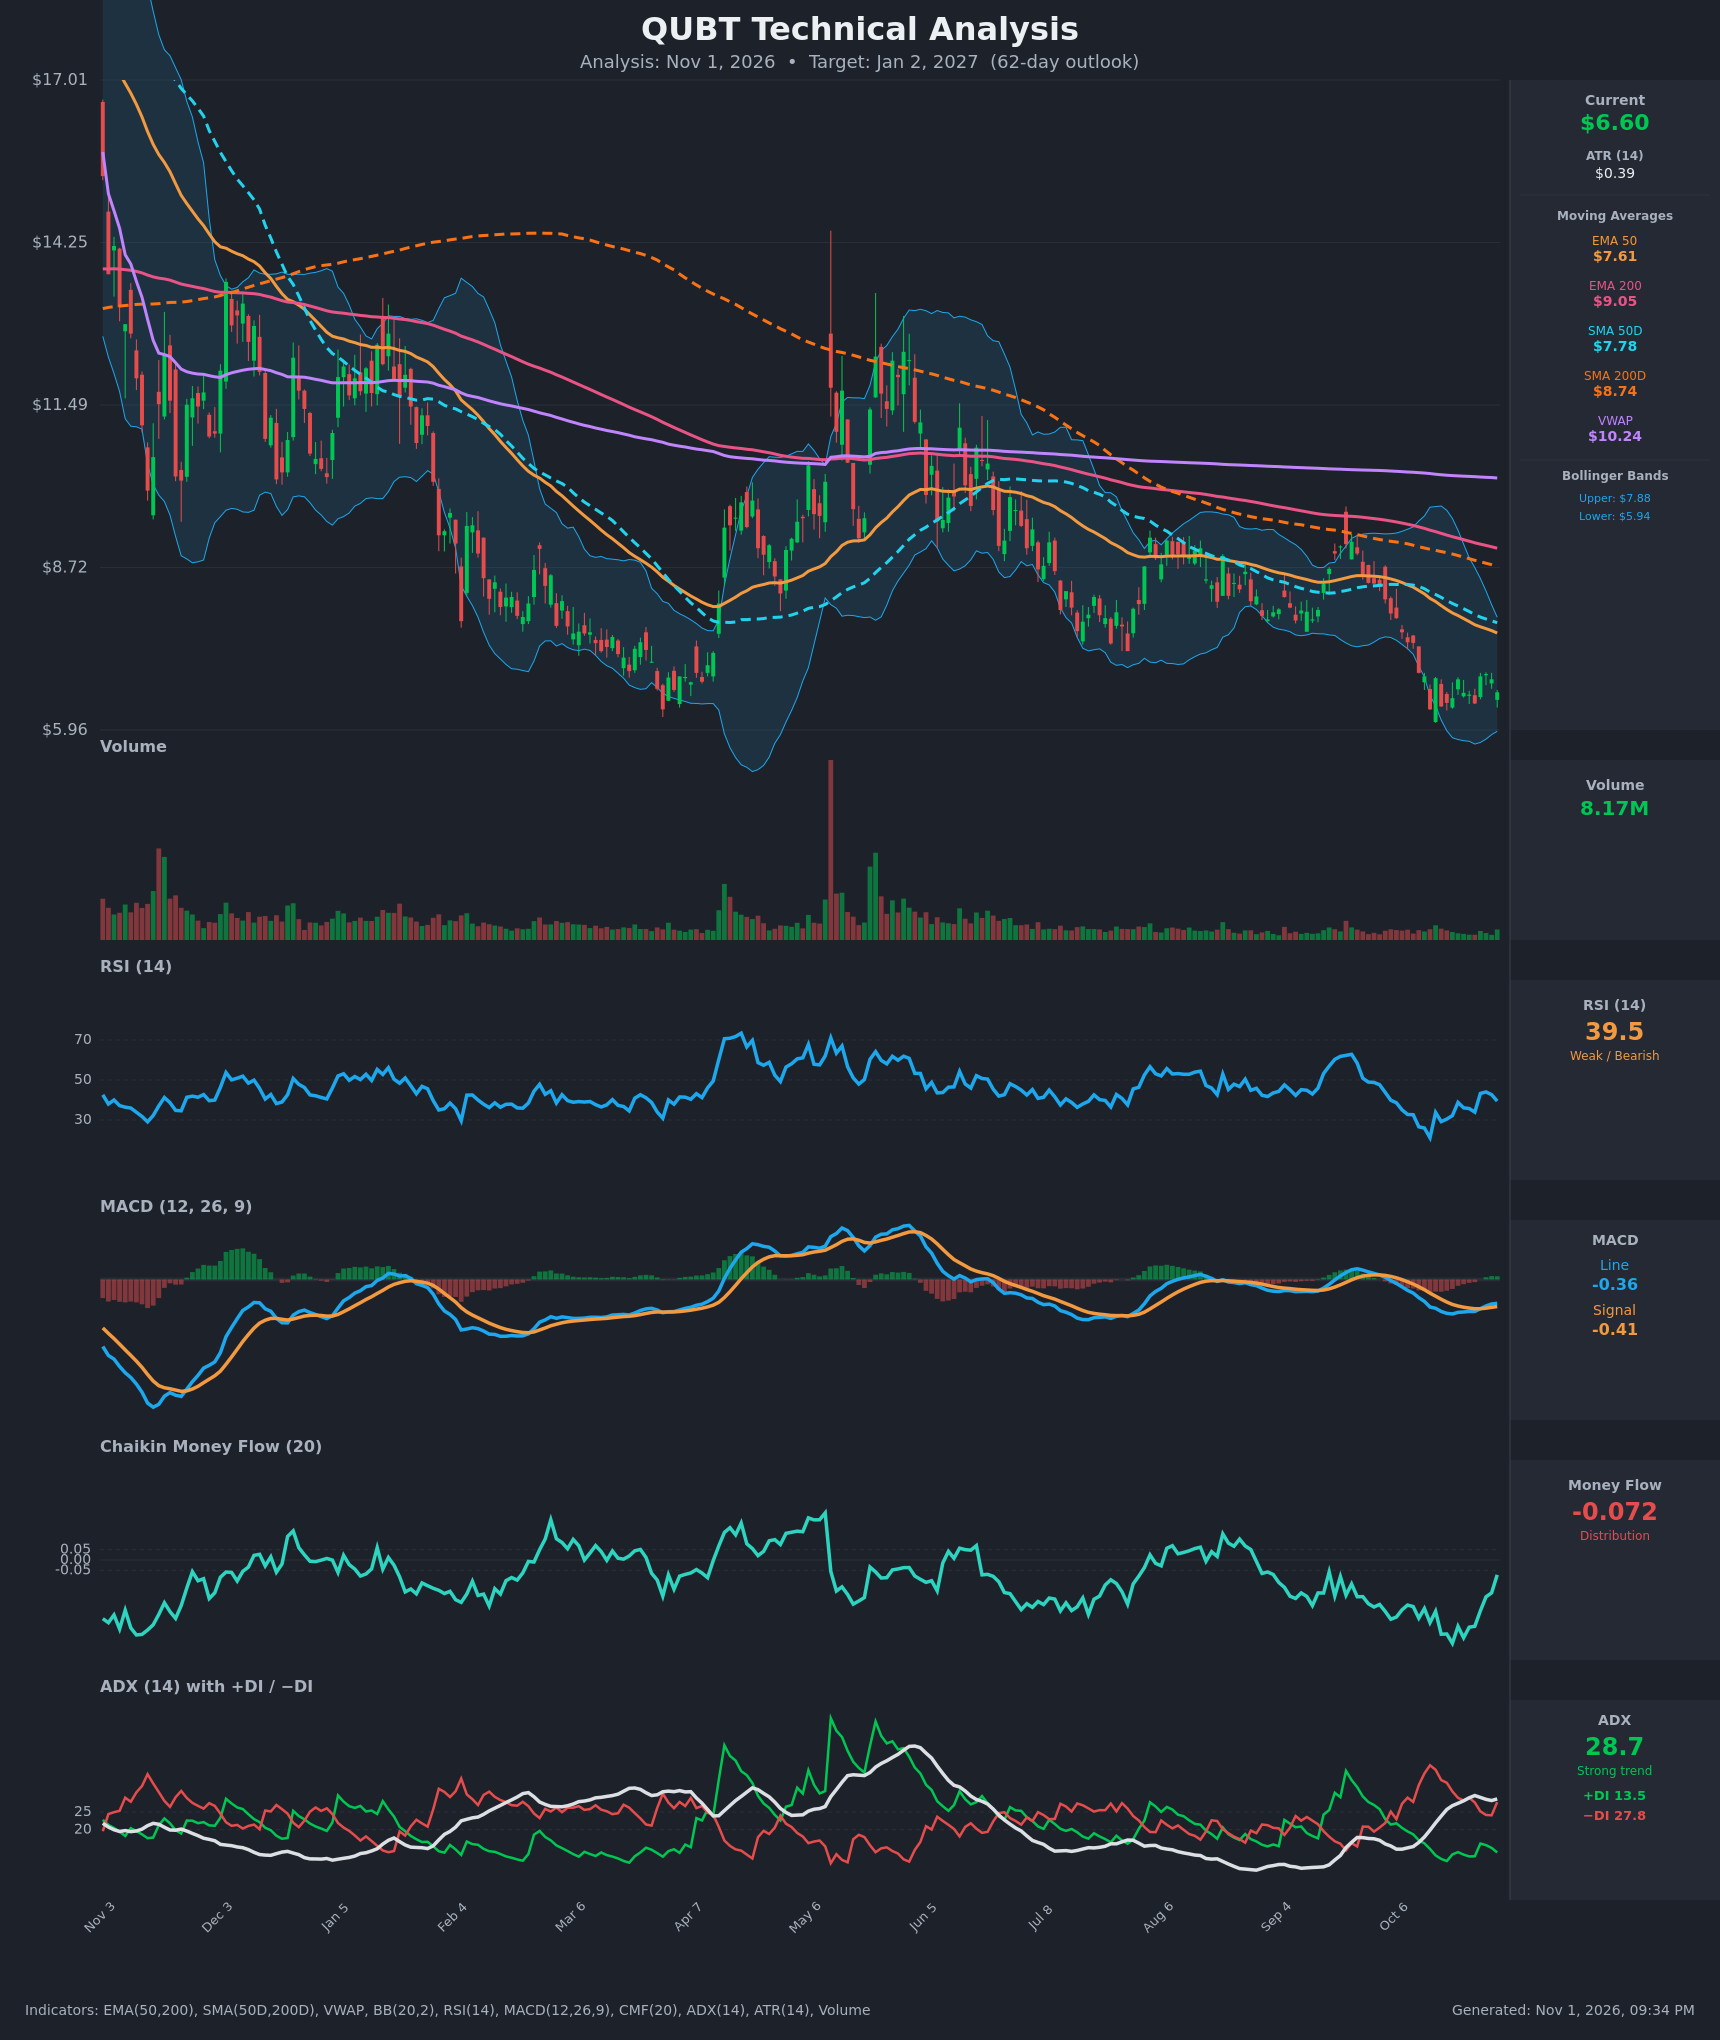
- RSI (14): 39.48, below 50 and off the 26 low on Oct 12-13 (oversold at 21 on Oct 14). It bounced to 44 on Oct 28 and is now rolling over again. Momentum is weak but not oversold. [Bearish]
- 20 EMA: The 20 EMA isn't supplied. The 50 EMA at $7.61 is falling and sits 15% above price, which is closed in a series of lower highs. Price is below the 50 EMA ($7.61), 200 EMA ($9.05), SMA50 ($7.78), SMA200 ($8.74) and VWAP ($10.24), so all of them act as overhead resistance. [Bearish]
- MACD: Line -0.364 is above Signal -0.413, so the histogram is slightly positive (+0.05). The line crossed up through the signal on Oct 27, but both remain well below zero. This is a weak relief bounce, not a trend reversal. [Neutral]
- Bollinger Bands (20): Upper $7.88, lower $5.94, midline about $6.91. Price at $6.60 is below the midline in the lower half of the bands. The bands have been trending down, and the lower band sits near the $5.96 low. [Bearish]
- CMF (20): -0.072, below the -0.05 threshold, so selling pressure is still present. It has improved from -0.40 on Oct 20, and the recovery is visible on the chart, but it hasn't turned positive. [Distribution]
- ADX (14): 28.7 with -DI 27.8 above +DI 13.5. The trend is strong and bearish. ADX has been rising since Oct 12 (16.4), though it has plateaued, and the DI spread has narrowed from 36/11 to 28/13. [Strong Trend - Bearish]
- Volume: 8.17M, which is below the averages seen during the earlier selloffs and rallies. Volume has faded steadily into the decline, which suggests some seller exhaustion but no accumulation or capitulation spike yet. [Neutral / Fading Participation]
DIVERGENCES & TRENDS
- Moving averages: The death cross (SMA50 below SMA200) is already in place. The gap is about $0.96 and has been stable over the last 15 bars. The 50 EMA is below the 200 EMA, also bearish. Price has been below the SMA200 for most of the chart. This is a clear long-term downtrend.
- MACD vs. price: MACD crossed up on Oct 27 while price made a lower low ($6.31 on Oct 14 and $6.41 on Oct 26). This is a mild, early bullish momentum divergence, but the MACD remains negative.
- RSI: RSI made a higher low (29 to 34) while price made roughly equal lows, which hints at stabilization. It is rolling over from 44 and hasn't crossed 50.
- CMF: CMF is improving off a deep low (-0.40 to -0.07) and is approaching neutral. This is a constructive sign, but it is not yet accumulation.
- ADX/DI: -DI is still dominant. The DI gap is narrowing, which suggests the selling pressure is easing but the bear trend remains intact.
- Price structure: Since Oct 14 price has been basing in a narrow $6.31-$6.93 band right at the multi-month low ($5.96-$6.00). It is a tight consolidation after a sharp breakdown from the $8-$9 area.
CHART PATTERNS
- Bearish Pennant / Flag (continuation): The sharp drop from about $8.5 to $6.3, followed by the tight, narrow-range consolidation from Oct 14-30, resembles a bearish flag or pennant. A breakdown below $6.30 would project roughly the pole's height (about $2) lower, though the lower target area around $4.5-$5 is aggressive for 62 days.
- Bearish Rising Wedge / downtrend channel: The multi-month series of lower highs and lower lows ($14 down to $6) is a persistent descending channel. Rallies keep failing at the falling 50-day averages.
- Possible Bullish Double Bottom: The lows at about $6.31 (Oct 14) and $6.41 (Oct 26) hold above the April low area of $6. This would need a break above the $6.93 neckline to confirm, with a target near $7.5. Right now it's unconfirmed and the weaker case.
POTENTIAL SCENARIOS
- Scenario 1: Bearish Breakdown / Continuation — The tight consolidation resolves lower as the downtrend continues with -DI dominant and all moving averages overhead. Price loses the $6.30 and $5.96 lows and heads toward the lower Bollinger Band and below. Trigger: Daily close below $6.30, then $5.96. Target: $5.40, with an extension to $4.90. Invalidation: Daily close above $7.10 on rising volume. (50% probability)
- Scenario 2: Neutral Base and Range — Price continues basing between about $5.90 and $7.50 as the selling exhausts, CMF stabilizes near zero and MACD stays flat. Trigger: Holding $6.00-$6.30 with CMF turning above -0.05. Target: $6.20-$7.20 range. Invalidation: Close below $5.90 or above $7.80. (28% probability)
- Scenario 3: Bullish Relief Rally — The double bottom neckline breaks, RSI moves above 50 and price squeezes toward the falling SMA50 and 50 EMA. Trigger: Close above $6.93, then $7.20 with volume expansion. Target: $7.60-$7.80 (SMA50/50 EMA). Invalidation: Close back below $6.30. (22% probability)
PRICE TARGETS
Range check: the 62-day timeframe calls for 18-30% of the current price. Width is $7.40 - $5.00 = $2.40, which is 36%. That is too wide, so I use $7.20 down to $5.00, or $2.20 (about 33%)... narrowing to $5.20 to $7.30 gives $2.10 (31.8%). Final: $5.30 to $7.20, width $1.90 (28.8%), which fits the guidance.
- Target Price: $5.85 (62 days, Jan 2, 2027)
- Expected Range: $5.30 to $7.20
- Key Levels: Support at $5.96, Resistance at $7.61
OVERALL BIAS
OVERALL BIAS: BEARISH - The death cross is in place, price is below every moving average and VWAP, -DI dominates a strong ADX (28.7), and CMF is still in distribution. The tight consolidation resembles a bearish flag, so a breakdown below $6.30/$5.96 is the most likely outcome, even though the early MACD and CMF improvement limits conviction.
This is educational analysis and not financial advice.