SLV 62-day bearish forecast — Nov 1, 2026
- Bias: Bearish
- Timeframe: 62 days (made Nov 1, 2026, target date Jan 1, 2027)
- Price at analysis: $44.60
- Price target: $42.00
- Expected range: $37.50 – $48.50
- Result: Pending — graded after the close on Jan 1, 2027
Get a free AI analysis of SLV today
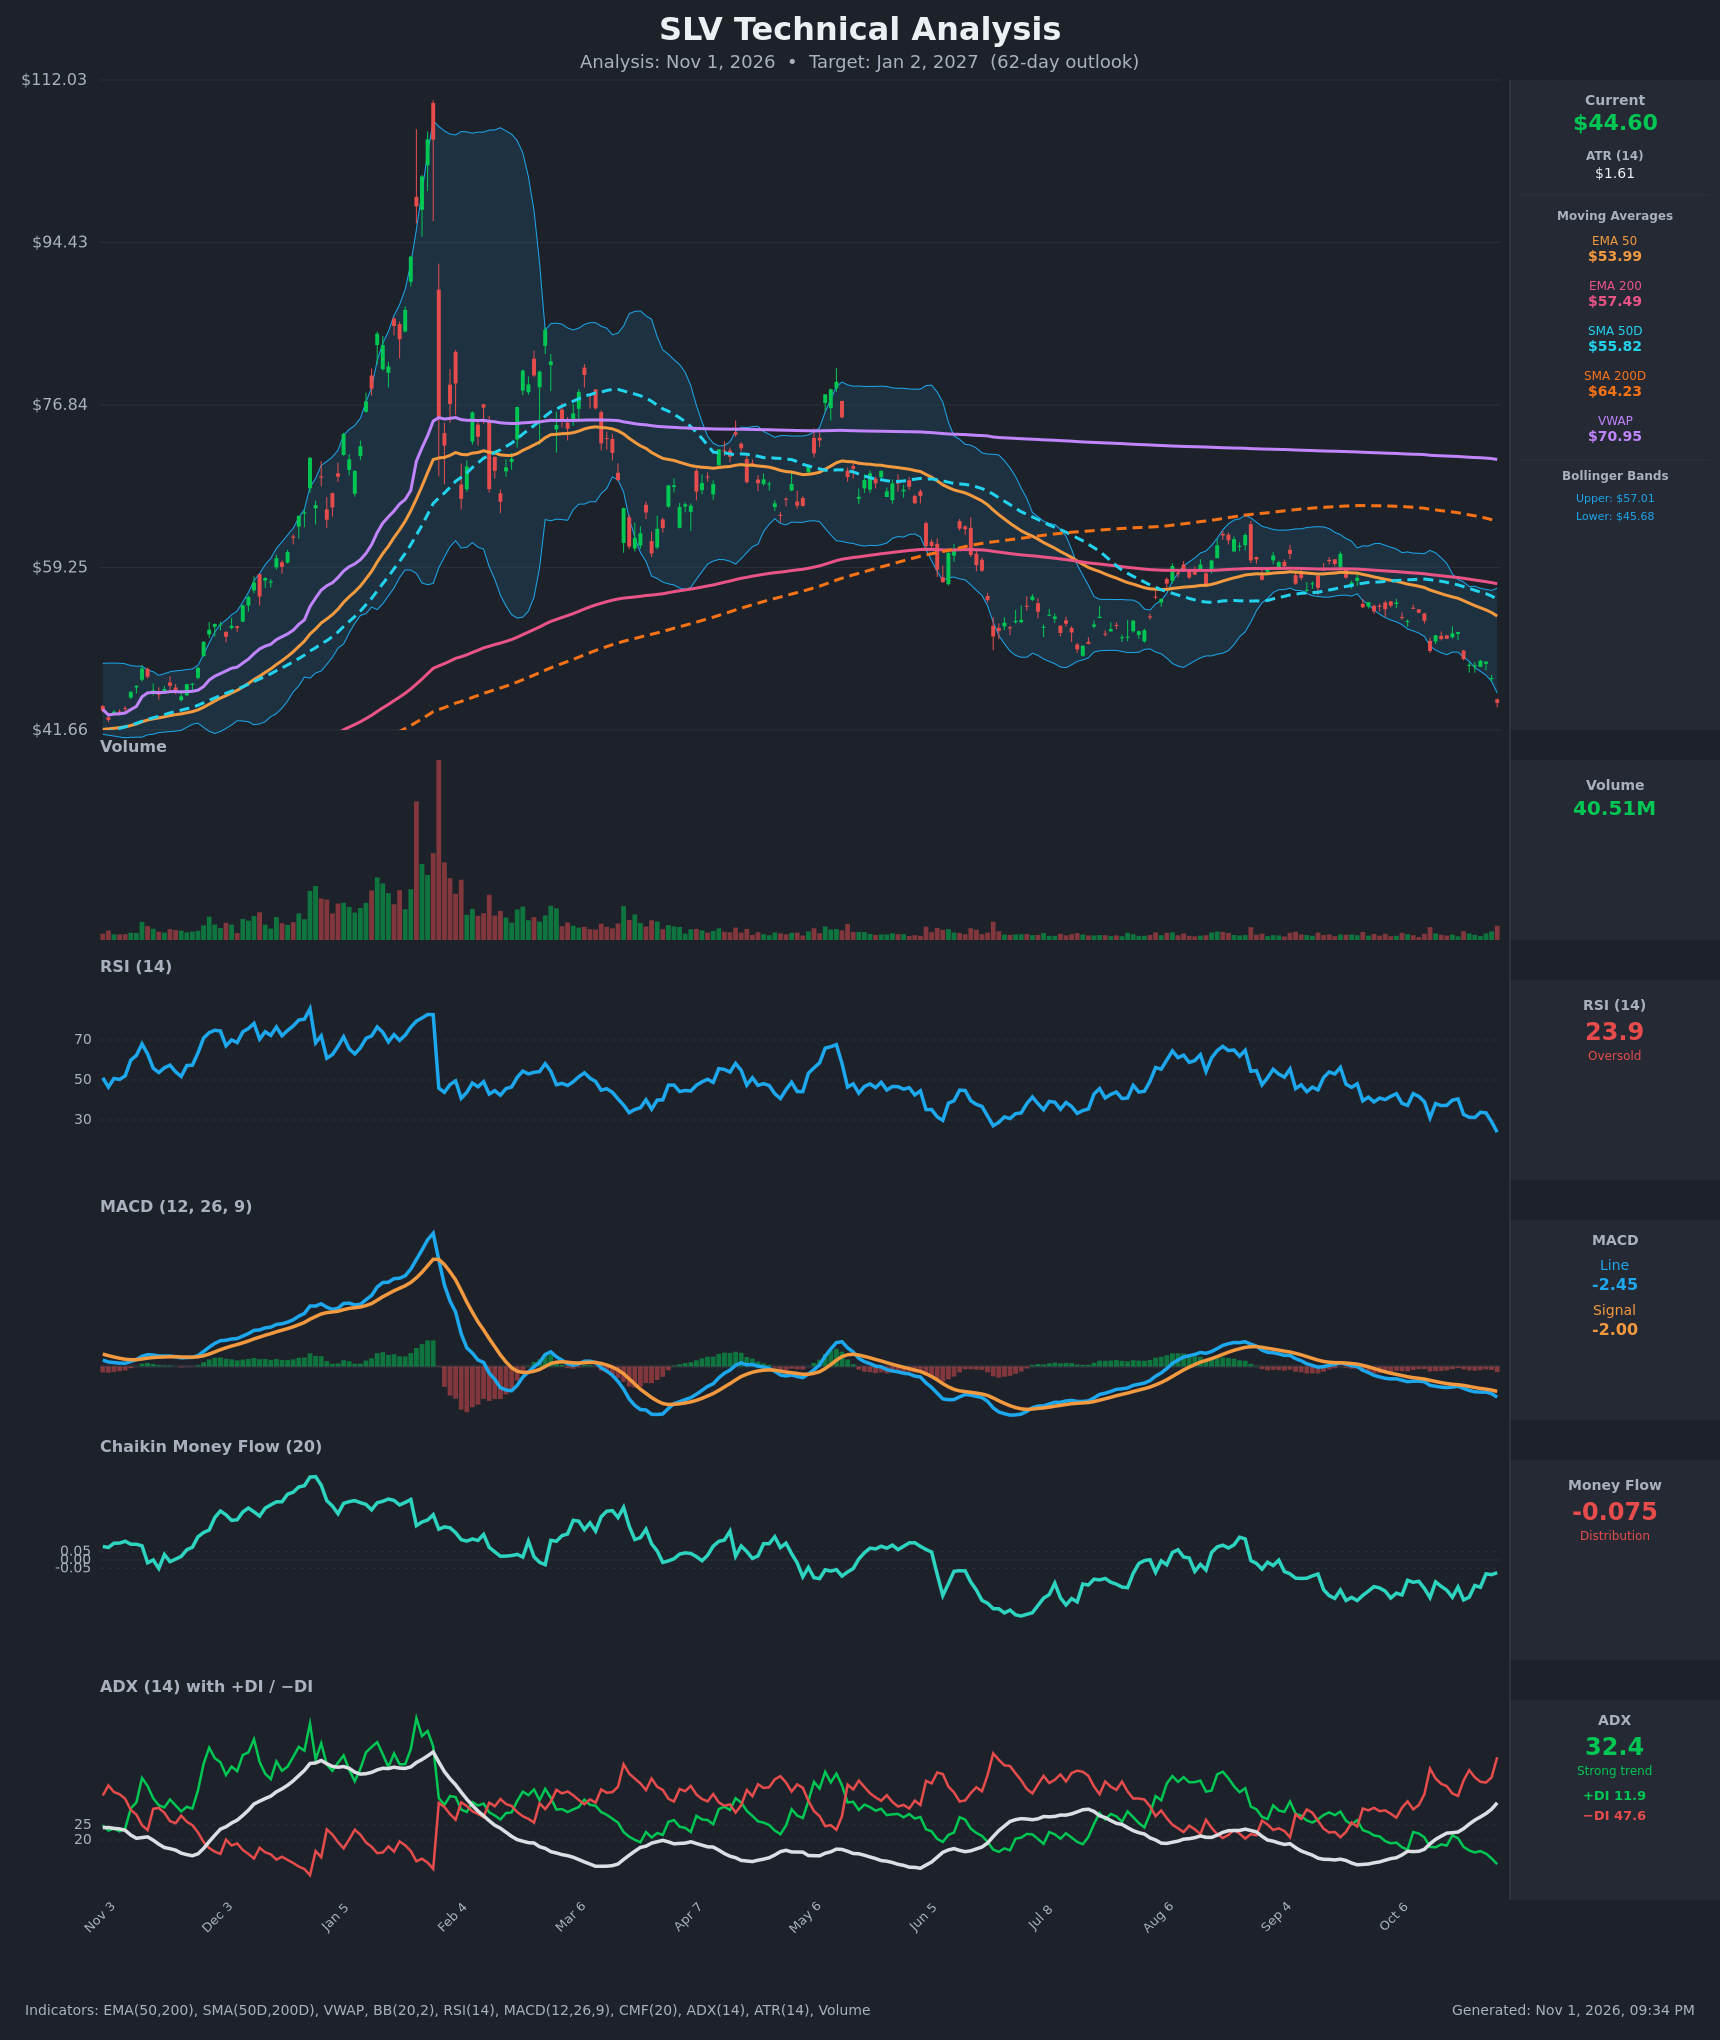
Analysis
TECHNICAL INDICATORS
- RSI (14): 23.90, the lowest reading on the chart and deeply oversold. It has fallen from 41.8 on Oct 12 and 33.6 on Oct 28, so momentum is still accelerating down. It has made a new low with price, so there is no bullish divergence yet. [Bearish]
- 20 EMA: The 20-period midline of the Bollinger Bands is about $51.34, roughly 15% above price. Price sits well below it, and it is now overhead resistance. EMA 50 ($53.99) and EMA 200 ($57.49) are stacked above price in bearish order. [Bearish]
- MACD: The line (-2.45) is below the signal (-2.00), and both are below zero. The line has been under the signal since mid-October and the gap is widening, so the negative histogram is expanding. [Bearish]
- Bollinger Bands (20): Price of $44.60 is below the lower band ($45.68), which is a band walk and a sign of strong downside momentum. The bands are widening (upper $57.01), so volatility is expanding. Closes outside the lower band can bring a snap-back toward the midline, but they are not reversal signals on their own. [Bearish]
- CMF (20): -0.075 is below the -0.05 threshold, which signals distribution. It has been negative for months, with only brief spikes above zero. It is not deeply negative, so selling pressure is steady rather than panicked. [Distribution]
- ADX (14): 32.4 and rising (from 16 on Oct 12), above the 25 threshold, which marks a strong trend. -DI is 47.6 against +DI at 11.9, a very lopsided gap, so bears are clearly in control. [Strong Trend - Bearish]
- Volume: 40.51M is the highest volume bar in months, apart from the Jan–Feb blow-off period. Heavy volume on a breakdown to new lows confirms the selling. It could also be early capitulation, but there is no reversal candle yet. [Bearish confirmation, possible capitulation]
DIVERGENCES & TRENDS
- No bullish divergence. RSI, MACD, and price are all making new lows together, so momentum confirms the decline.
- Moving averages: SMA 50D ($55.82) is below SMA 200D ($64.23), a death cross that has already occurred. EMA 50 is also below EMA 200. Price is below every moving average and below VWAP ($70.95), so the long-term trend is down.
- Trend progression: Price fell from about $54.35 to $44.60 in 13 sessions (about -18%). ADX rose from 16 to 32 and -DI doubled in that time, which is the pattern of a young, strengthening downtrend.
- MACD: Both lines are falling below zero. There is no sign of a bullish crossover.
- Oversold risk: RSI below 25 and a close below the lower band mean sharp relief rallies are likely along the way. RSI stayed oversold-to-low for long stretches in the earlier Jun–Jul decline.
- Structure: Price has made lower highs and lower lows since the ~$109 peak in January. The Aug–Sep bounce failed near $62 and below the 200-period averages.
CHART PATTERNS
- Bearish continuation / breakdown from consolidation: Price moved sideways in a roughly $55–$62 band from Aug to Sep, similar to a Bearish Flag/Rectangle. It broke down in October. The range height of about $7–8 projects a first measured move to roughly $47–$48, which has been reached and exceeded.
- Large-scale rounded top / Head-and-Shoulders-like distribution: The ~$109 spike, the failed rally to ~$80 in May, and the lower high near $62 form a descending sequence of peaks. This points to a long-term downtrend.
- Reversal pattern check: There is no Double Bottom, Falling Wedge, or Inverted Head & Shoulders yet. A bullish reversal would need a base to form, such as a higher low after a capitulation flush.
POTENTIAL SCENARIOS
- Scenario 1: Bearish Trend Continuation — The strong ADX trend and -DI dominance keep pushing price lower, with a relief bounce toward $48–$49 that fails under the falling 20 EMA. Trigger: a close below $44 and failure to reclaim $45.68 (the lower Bollinger Band). Target: $41.50–$42.50, with an extension to $39–$40. Invalidation: a daily close above $51.30 (the 20-period midline) with RSI back above 45. (50% probability)
- Scenario 2: Bullish Oversold Mean-Reversion Bounce — Capitulation volume and RSI below 25 trigger a snap-back toward the declining averages. Trigger: a reversal candle with a close back inside the Bollinger Band and RSI turning up above 30 with a MACD histogram contraction. Target: $49–$51.30, the prior breakdown zone and the 20-period midline. Invalidation: a close below $42 on rising volume. (33% probability)
- Scenario 3: Neutral Base Formation — Price stabilizes after the flush and ranges in a wide band between about $41 and $48 as ADX cools. Trigger: successive daily closes between $42 and $47 with ADX falling below 25. Target: $44–$46. Invalidation: a decisive break outside $41–$48. (17% probability)
PRICE TARGETS
- Target Price: $42.00 (62-day horizon, Jan 2, 2027)
- Expected Range: $37.50 to $48.50. Width is $11.00, about 24.7% of the current price, which fits the 61–180 day guidance.
- Key Levels: Support at $40.00, Resistance at $48.66
OVERALL BIAS
OVERALL BIAS: BEARISH - Price is below every moving average and below the lower Bollinger Band. The death cross is in place, ADX is 32.4 and rising with -DI at 47.6 against +DI at 11.9, MACD and CMF are negative, and RSI has made no bullish divergence. Heavy volume confirms the breakdown. The oversold RSI makes a relief bounce likely along the way, but the evidence favors a lower price over 62 days.
This is educational analysis and not financial advice.